
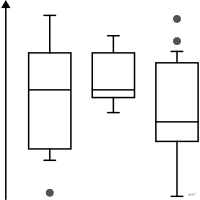
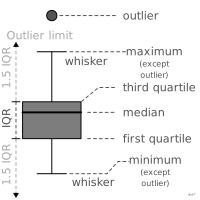
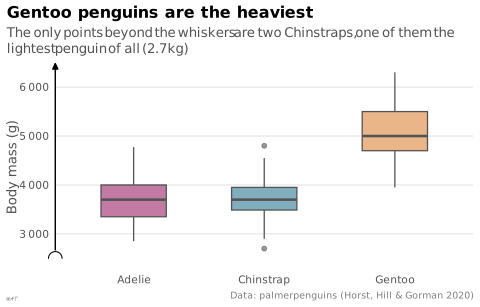

 chart
box plot
also: box and whisker plot, boxplotDistribution summary using median, quartiles and extremes.
Classification
- chart
- boxes and densities › boxes
- distribution; Financial Times Visual Vocabulary
- the name evokes: nature, object
Channels
 position on common scale; main: median, quartiles, whiskers; Munzner 2014
 length; secondary: interquartile range (box height); Munzner 2014
 area; secondary: interquartile range (the area can sometimes depend on the number of points); Munzner 2014
 spatial region; main: group; Munzner 2014
 color hue; secondary: group; Munzner 2014
Variants
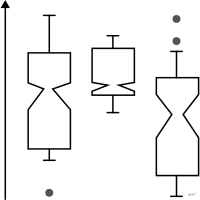 notched box plotnotched
Attestation
- English definition: Financial Times Visual Vocabulary
Scientific literature
OpenAlex: 13 158 papers since 1977, 52% in the last five years; mostly in Medicine, Computer Science, Environmental Science; Wikidata
Seminal references
- invention (1977) Tukey (1977). Exploratory Data Analysis. Addison-Wesley; Ciuccarelli 2026
R packages
- R
ggplot2::geom_boxplot(); GitHub 7 025 stars; last commit 2026-10; paper (33 455 citations)
R code of the ggplot2 example
library(ggplot2)
library(palmerpenguins)
p <- ggplot(penguins, aes(x = species, y = body_mass_g, fill = species)) +
geom_boxplot(colour = "#535353", alpha = 0.6, width = 0.5, na.rm = TRUE) +
scale_y_continuous(labels = lex_number, breaks = lex_break_breaks, expand = lex_break_expand) +
labs(title = "Gentoo penguins are the heaviest",
subtitle = "The only points beyond the whiskers are two Chinstraps, one of them\nthe lightest penguin of all (2.7 kg)",
x = NULL, y = "Body mass (g)",
caption = "Data: palmerpenguins (Horst, Hill & Gorman 2020)") +
theme_lex_viz(grid = "y", arrows = "y", break_not_zero = "y") +
theme(legend.position = "none")Sources (41)
336 occurrences in the corpus; indexed by 19 books
Show the 41 sources
- analysisfunction.civilservice.gov.uk
- app.flourish.studio
- Applied Multivariate Statistics in R
- Atlas of knowledge: anyone can map
- Better data visualizations: a guide for scholars, researchers, and wonks
- Bremer & Barone, Chart, CRC Press, 2025
- Cartography: thematic map design
- cedricscherer.com↗
- Computational statistics in data science
- Data fluency: empowering your organization with effective data communication
- Data points: visualization that means something
- Data Visualisation Guide, data.europa.eu
- Data visualisation: a handbook for data driven design
- Data visualization handbook
- Data visualization: a practical introduction
- Effective data storytelling: how to drive change with data, narrative, and visuals
- Effective data visualization: the right chart for the right data
- Exploratory Data Analysis: Descriptive Analysis, Visualization, and Dashboard Design (w...
- Financial Times Visual Vocabulary
- Friendly & Wainer, A History of Data Visualization and Graphic Communication, Harvard University Press, 2021
- Handling and mapping geographic information
- Info we trust: how to inspire the world with data
- Information Graphics: A Comprehensive Illustrated Reference
- LibreTexts Statistics, textbook chapters on charts
- Milestones in the history of thematic cartography, statistical graphics, and data visua...
- More Practical Charts
- Seeing with fresh eyes: meaning, space, data, truth
- Show me the numbers: designing tables and graphs to enlighten
- The big book of dashboards: visualizing your data using real-world business scenarios
- The elements of graphing data
- The grammar of graphics
- The Truthful Art: Data, Charts, and Maps for Communication
- The visual display of quantitative information
- Thematic Cartography and Geovisualization
- Visual strategies for biological data
- Visualization Analysis and Design
- Visualization of Time-Oriented Data
- Visualize This
- Wickham, Çetinkaya-Rundel & Grolemund, R for Data Science, 2nd ed., 2023
- Wikipedia — Data and information visualization
- Wikipedia in English↗
Cite this entry
Stable addresshttps://dataviz.adrientaudiere.com/en-only/term/box-plot.html
ReferenceTaudière Adrien. 2026. box plot. In Visualization Vocabulary, version 1.0.0. IdEst. https://dataviz.adrientaudiere.com/en-only/term/box-plot.html
BibTeX
@incollection{taudiere2026-box-plot,
  author    = {Taudière, Adrien},
  title     = {box plot},
  booktitle = {Visualization Vocabulary},
  year      = {2026},
  version   = {1.0.0},
  publisher = {IdEst},
  url       = {https://dataviz.adrientaudiere.com/en-only/term/box-plot.html},
  note      = {CC0 1.0}
}Page created on 2026-10-13. Text last changed on 2026-11-06. Images last changed on 2026-11-12. Numbers computed on 2026-10-22.