
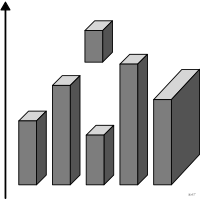
3D chart
Chart whose marks are rendered as volumes although the third dimension encodes no data.
chart, critique
abstraction
Restating a concrete problem in terms of data and task types.
process
accessibility
Design allowing use by people with varied abilities.
process
accuracy
Closeness of a measurement to the true value.
statistics
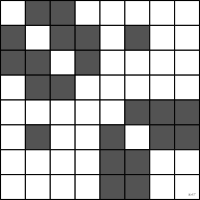
adjacency matrix
Square matrix encoding the presence of links between nodes.
chart, matrices and tables
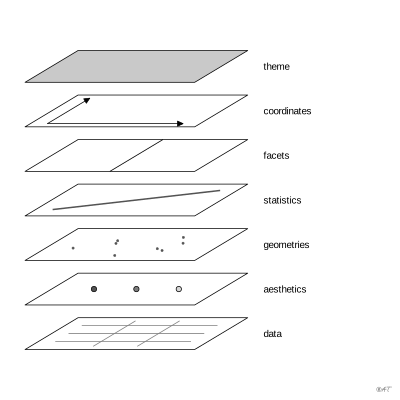
aesthetic
Mapping of a variable to a graphical attribute in the grammar of graphics.
encoding
affective objective
Learning objective about an attitude or value of the viewer rather than about a fact.
process
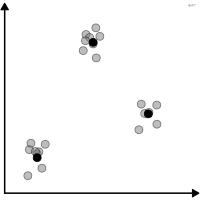
aggregation
Summarizing several observations into a single value.
data
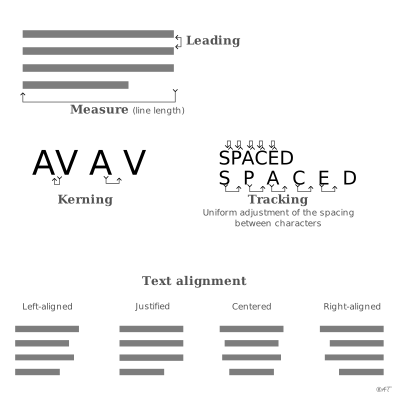
alignment
Matching of the edges of elements.
typography
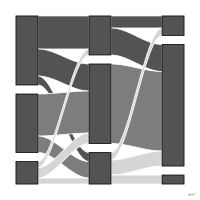
alluvial diagram
Blocks stacked at each stage of an ordered sequence, linked from one stage to the next by bands whose width encodes the count moving from one group to another.
chart, flows
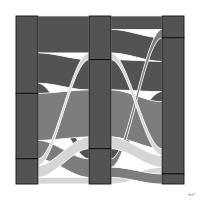
alluvial plot
Gapless stacked blocks at each stage of an ordered sequence, crossed by ribbons that each follow the same group of units from the first stage to the last; the height of a column gives the count at that stage.
chart, flows
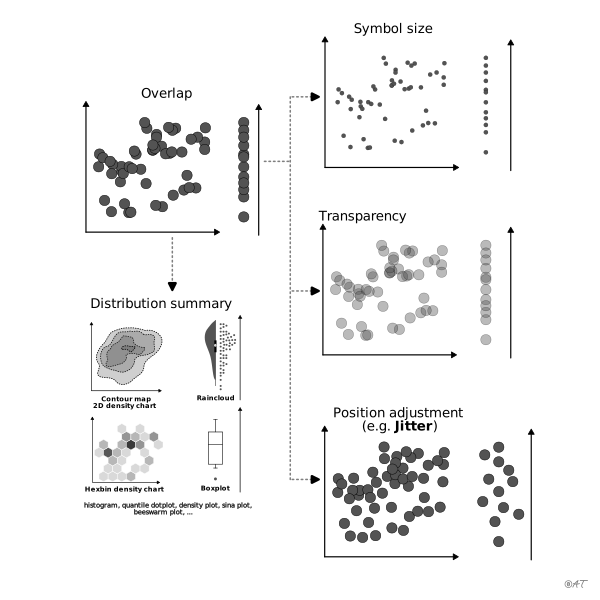
alpha
Degree of transparency of a mark.
encoding
alt text
Textual description of a figure for screen readers.
process

angle
Opening of a sector encoding a quantity.
encoding
animated transition
Continuous movement of marks between two states to preserve tracking.
interaction
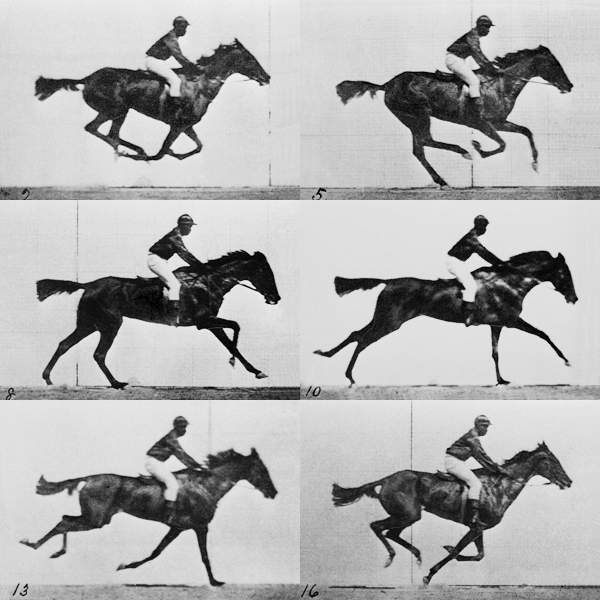
image: Wikimedia Commons, Eadweard Muybridge, Public domain
animation
Time transition between successive states of a view.
interaction
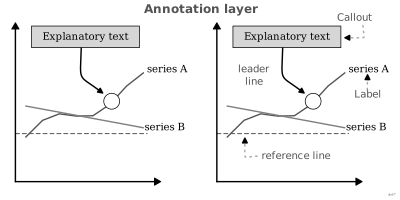
annotation
Text or stroke added to point out something notable.
encoding
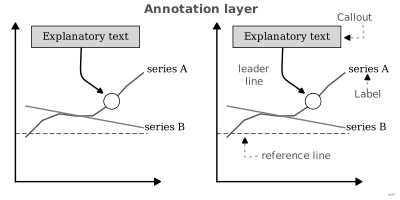
annotation layer
Set of explanatory elements layered over the representation.
encoding
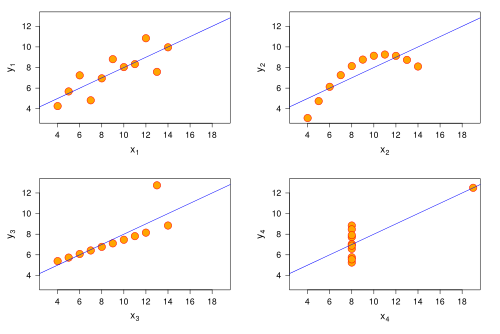
image: Wikimedia Commons, voir Wikimedia Commons, GPL
Anscombe's quartet
Four datasets with identical statistics but very different shapes.
statistics
anti-objective
Conclusion the viewer should not draw from the visualization.
process
APCA
Text-background contrast measure grounded in perception rather than a plain luminance ratio.
color
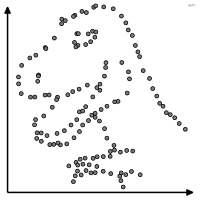
apophenia
Perception of structure in purely random data.
critique
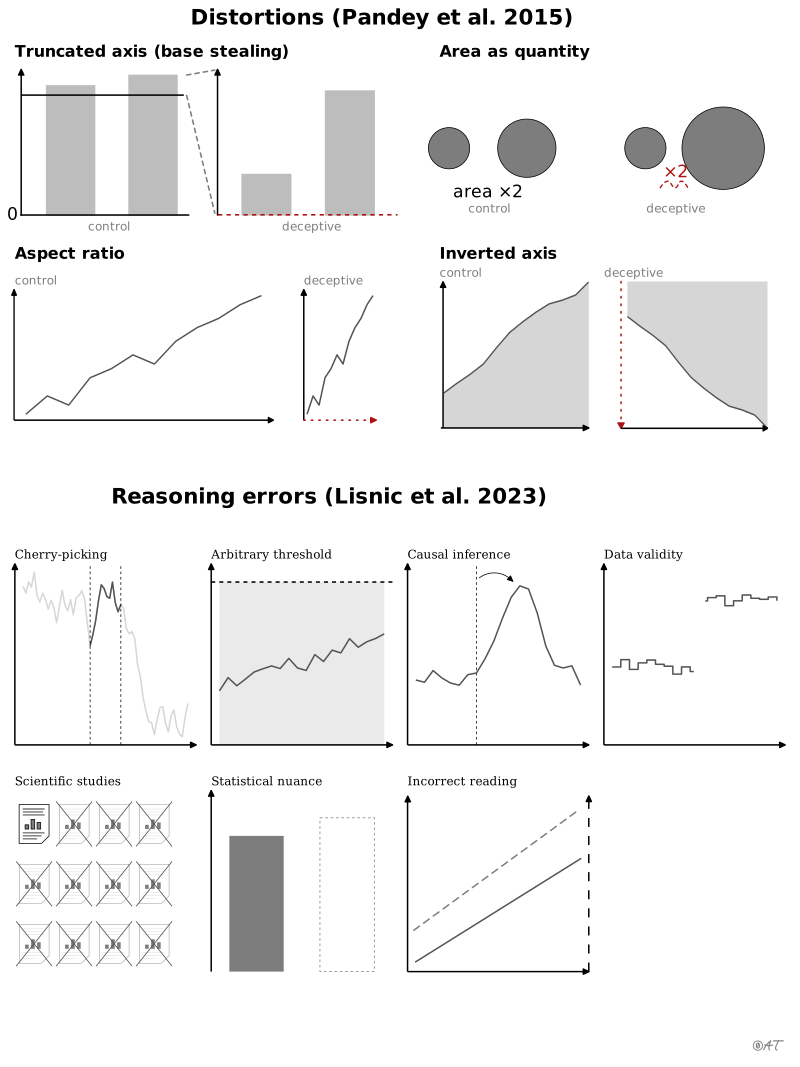
arbitrary threshold
Cutoff picked without justification and used as the yardstick for a phenomenon.
critique
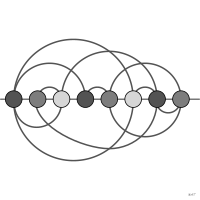
arc diagram
Nodes on a line joined by arcs.
chart, networks and trees

area
Area of a mark encoding a quantity.
encoding
area as quantity
Value encoded by the radius of a shape rather than by its area.
critique
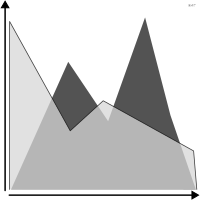
area chart
Line chart with the area under the line filled in.
chart, lines and areas
arrangement
Layout of the elements within a mark used as a visual variable.
encoding
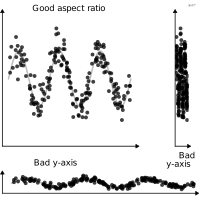
aspect ratio
Ratio of width to height of the plotting area.
encoding
assistive technology
Hardware or software compensating for an impairment to access content.
process
associativity
Property of a visual variable leaving categories equally visible.
perception
atlas
Organized collection of maps covering a territory or a theme.
map
attention
The gaze selecting one part of the scene at the expense of the rest.
perception
audience
Intended group of recipients for the visualization.
process
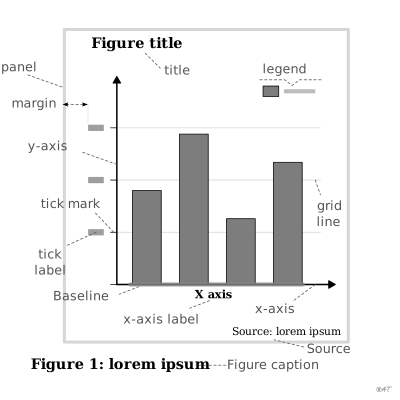
axis
Graduated line materializing a scale.
encoding
axis label
Text naming the variable carried by an axis and its unit.
encoding
banding
Spurious visible boundaries in a continuous gradient.
critique
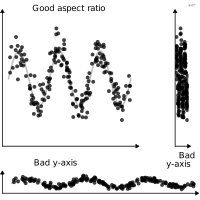
banking to 45 degrees
Choosing the aspect ratio so average slopes sit near 45 degrees.
encoding
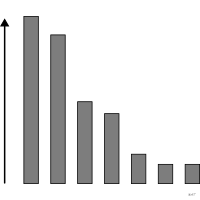
bar chart
Bars whose length encodes a quantity compared across categories.
chart, bars
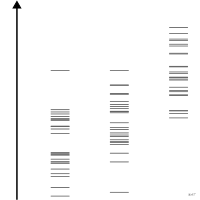
barcode plot
Every value drawn as a thin tick on a single axis.
chart, points and bubbles
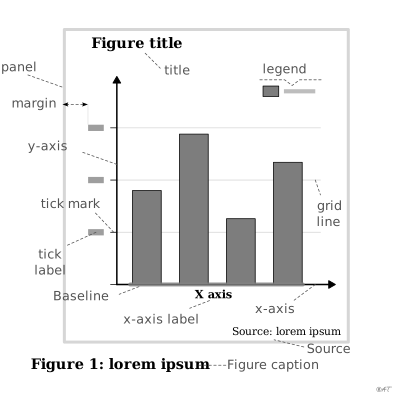
baseline
Reference value from which marks start.
encoding
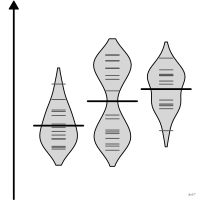
bean plot
Mirrored density in which each observation is a short line, and the group mean a longer one.
chart, boxes and densities
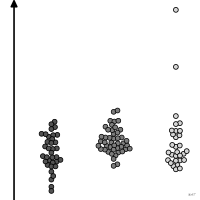
beeswarm plot
Non-overlapping offset points revealing local density.
chart, points and bubbles
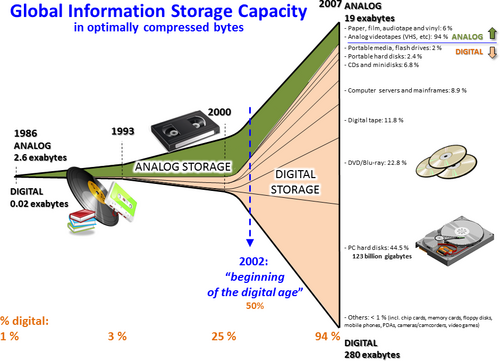
image: Wikimedia Commons, Martin Hilbert, Priscila López, CC BY-SA 3.0
big data
Data too large or too fast for conventional tools.
data
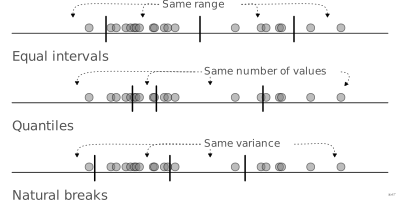
bin
Interval of grouped values.
encoding
binning
Splitting a continuous variable into intervals.
encoding
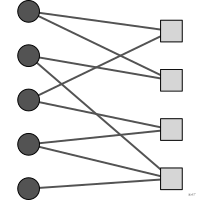
bipartite network
Network whose nodes form two sets with every link joining one node from each set.
chart, networks and trees
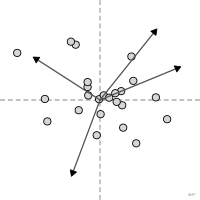
biplot
Simultaneous projection of individuals and variables of an ordination.
chart, points and bubbles
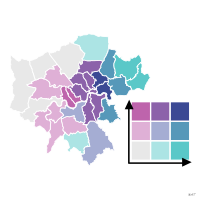
bivariate map
Map that crosses two variables in a single color legend.
map, maps
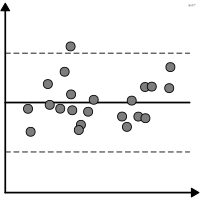
Bland-Altman plot
Difference between two measurements against their mean.
chart, points and bubbles
block diagram
Diagram of a system in which each component is a box and each exchange a line or arrow between boxes, with no internal detail.
figure, non-chart figures
bootstrap
Uncertainty estimated by repeated draws from the sample.
statistics
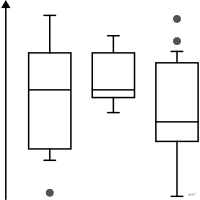
box plot
Distribution summary using median, quartiles and extremes.
chart, boxes and densities
branch support
Value borne by a branch measuring confidence in the grouping.
encoding
brief
Document framing the request, objectives and constraints.
process
brightness
Perceived light intensity of a source or surface.
perception
brushing
Direct selection of a subset of marks.
interaction
brushing and linking (interaction)
Propagation of a selection to all coordinated views.
interaction
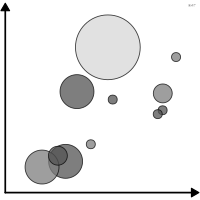
bubble chart
Scatterplot where size encodes a third variable.
chart, points and bubbles
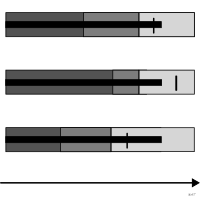
bullet graph
Single bar compared to a target and reference bands.
chart, bars
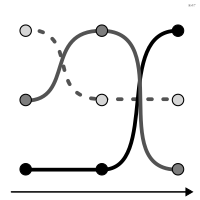
bump chart
Change in rank of several entities over time.
chart, lines and areas
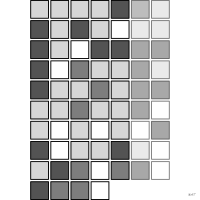
calendar heatmap
Calendar grid where each day is colored by a value.
chart, matrices and tables
calligram
Text laid out so as to draw a figure related to its meaning.
figure
callout
Annotation linked to a precise point by a line.
encoding
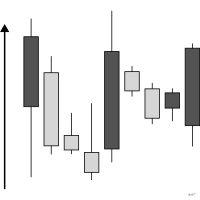
candlestick chart
Mark encoding open, close, low and high over a period.
chart, bars
caption
Text under the figure identifying and explaining it.
process
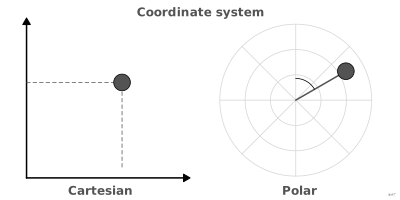
Cartesian coordinates
Frame with perpendicular axes.
encoding
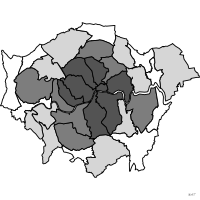
cartogram
Map whose areas are distorted in proportion to a variable.
map, maps
cartographic generalization
Simplification of a map by selecting, smoothing, aggregating or displacing features to suit its scale and purpose.
map
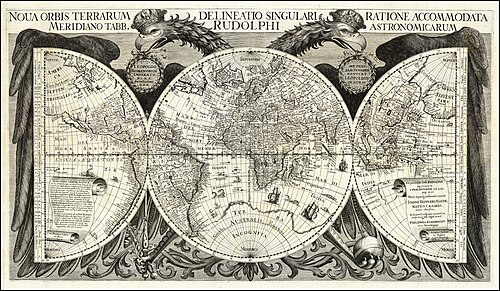
image: Wikimedia Commons, Johannes Kepler, Public domain
cartography
Art and technique of designing and reading maps.
map
categorical data
Data whose values are unordered categories.
data
category
“Identifiable part of a component or of a variable” (Bertin, translated).
data
causal inference
Cause-and-effect link read into a chart without the data establishing it.
critique
central tendency
Typical value around which data cluster, such as the mean, median or mode.
statistics

image: Wikimedia Commons, Globe_and_high_court.jpg: created by jjron Globe_and_high_court_fix.jpg: created by jjron, edited by Fir0002 derivative work: WikiCantona (talk), CC BY-SA 3.0
change blindness
Failure to notice a visual change between two views.
perception
channel
Graphical attribute of a mark that encodes a value.
encoding
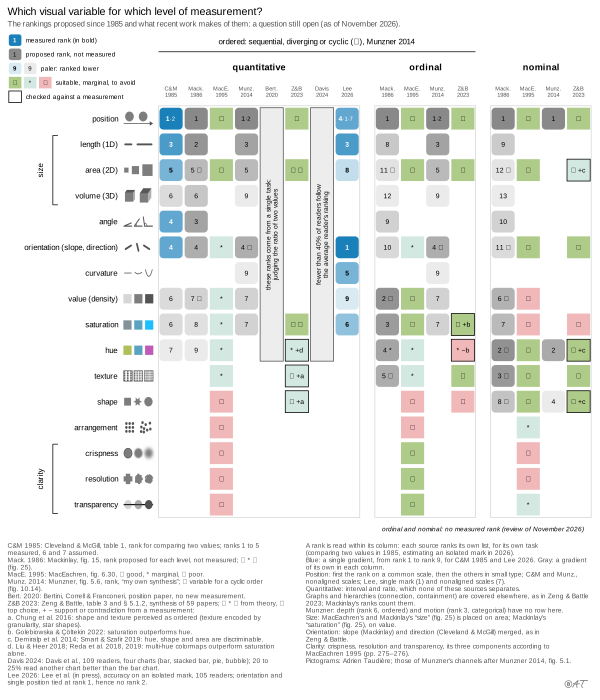
channel ranking
Ordering of visual channels by how accurately readers decode them for a given attribute type and task.
encoding
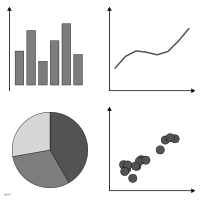
chart
Visual representation of data through positioned marks and graphical attributes.
chart
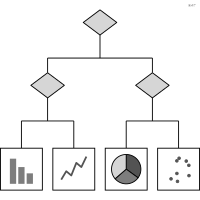
chart chooser
Decision tree leading from the need to the chart type.
process
chart type
Established combination of marks, attributes and layout that goes by a name of its own.
encoding
Chartability
Set of heuristics for auditing the accessibility of a data visualization.
process
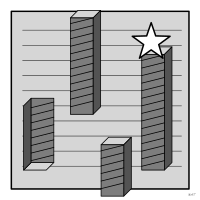
chartjunk
Graphical ornament that carries no information.
critique
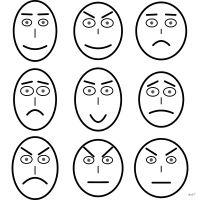
Chernoff faces
Multivariate display in which each variable drives one feature of a drawn human face.
chart, glyphs
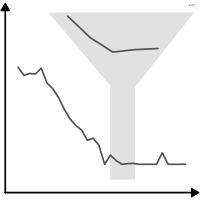
cherry-picking
Choosing the data or period that supports the desired conclusion.
critique
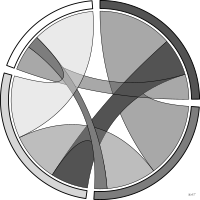
chord diagram
Relationships between entities placed around a circle.
chart, flows
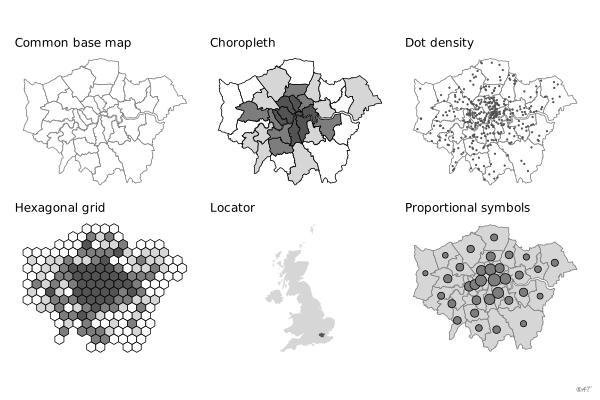
choropleth map
Map whose areas are colored by a relative value.
map, maps
CIELAB
Space approximately uniform for human perception.
color
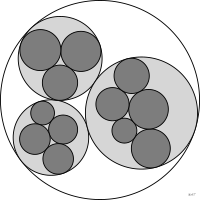
circle packing
Hierarchy shown as nested circles.
chart, sectors, tilings and units
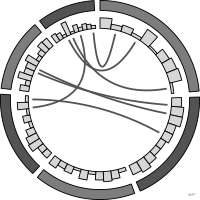
Circos plot
Relationships between genomic regions arranged around a circle.
chart, radial
classed color scale
Scale assigning one flat color to each class of values.
color
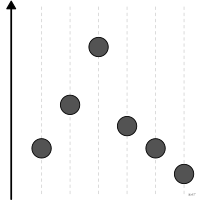
Cleveland dot plot
Dots positioned on a shared axis against categories.
chart, bars
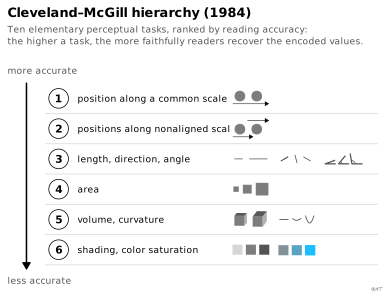
Cleveland-McGill hierarchy
Ranking of encodings by reading accuracy with position first.
perception
closure
The eye completes incomplete shapes.
perception
clustering
Grouping of observations into classes that are not set in advance.
statistics
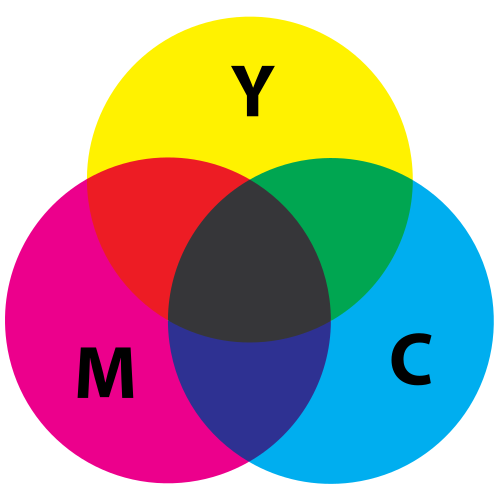
image: Wikimedia Commons, SharkD, CC0
CMYK
Subtractive model used in printing.
color
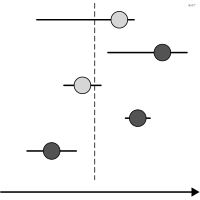
coefficient plot
Model coefficients and their intervals aligned on a common axis.
chart, points and bubbles
cognitive load
Mental effort demanded by reading a representation.
perception
color bar
Continuous legend showing the color-value mapping.
encoding
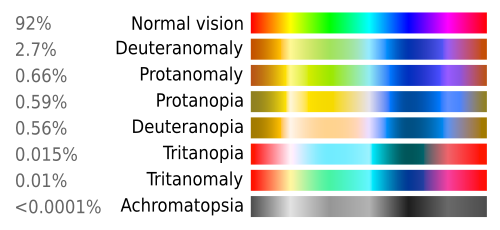
image: Wikimedia Commons, SyntaxTerror, Public domain
color blindness
Reduced perception of certain hue differences.
color
color model
System for describing colors such as RGB, HSL or CIELAB.
color
color ramp
Continuous progression of colors mapped to values.
color
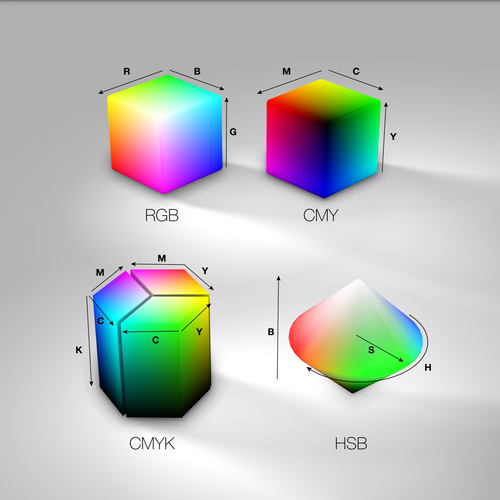
image: Wikimedia Commons, Avsa, CC BY 4.0
color space
Geometric representation of the set of colors.
color

image: Wikimedia Commons, Crossover1370, CC BY-SA 4.0
color wheel
Circular arrangement of hues.
color
color–emotion association
Consistent link between a color and an emotion within a given audience.
color
ColorBrewer
Set of cartographic palettes tested for legibility.
color
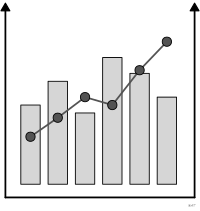
combination chart
Two mark types overlaid in the same coordinate system.
chart, composites
common fate
Elements moving together are perceived as a group.
perception
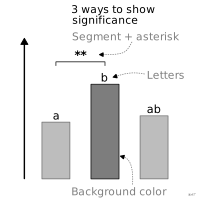
compact letter display
Letters shared by the groups a test cannot tell apart.
encoding
complementary colors
Hues opposite on the color wheel.
color
component
Variable of the information transcribed in the graphic.
encoding
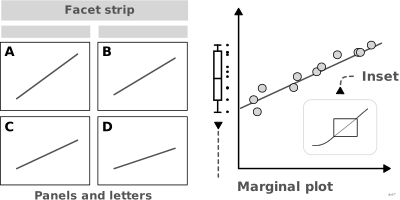
composite figure
Figure gathering several panels under one caption and one number.
process
compromise projection
Projection that preserves neither angles nor areas but limits both distortions.
map
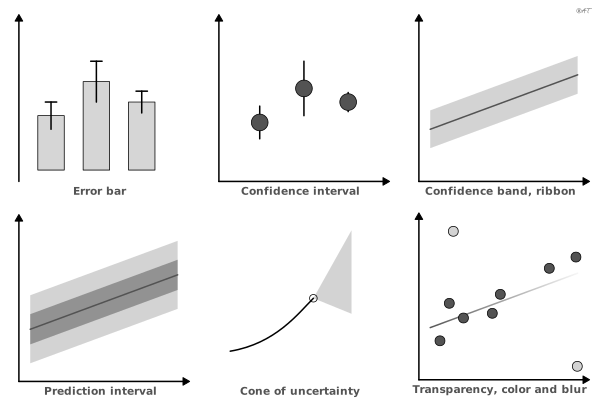
cone of uncertainty
Cone-shaped area around the forecast track of a hurricane showing uncertainty about the position of its center.
encoding
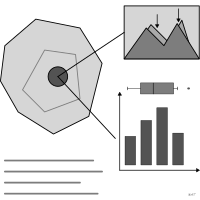
confection
Assembly of visual events drawn from various sources and juxtaposed to carry an argument.
chart, non-chart figures
confidence band
Area framing a fitted curve and showing the uncertainty of the fit.
encoding
confidence interval
Interval expected to contain the parameter at a given rate.
statistics
confirmation bias
Tendency to retain only what confirms the expectation.
critique
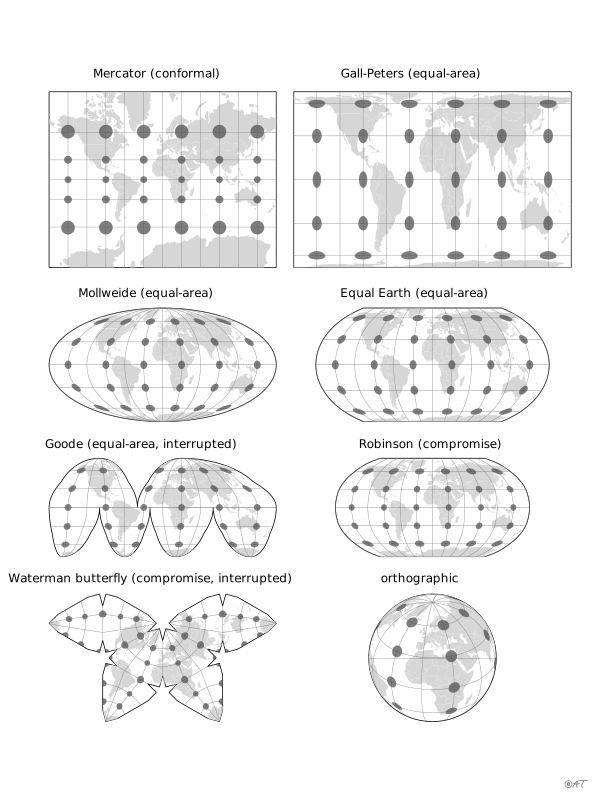
conformal projection
Projection preserving angles, and thus local shape, while distorting areas.
map
confusion matrix
Table crossing the observed classes with the classes predicted by a model.
statistics
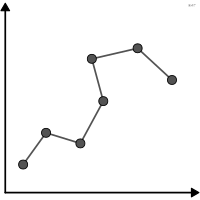
connected scatterplot
Scatterplot whose points are joined in time order.
chart, points and bubbles
consistency
Using the same encoding for the same quantity across a series of figures.
process
continuity
The eye follows the smoothest paths.
perception
continuous variable
Variable that can take any value in an interval.
data
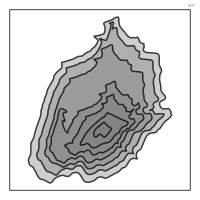
contour map
Lines joining points of equal value.
map, maps
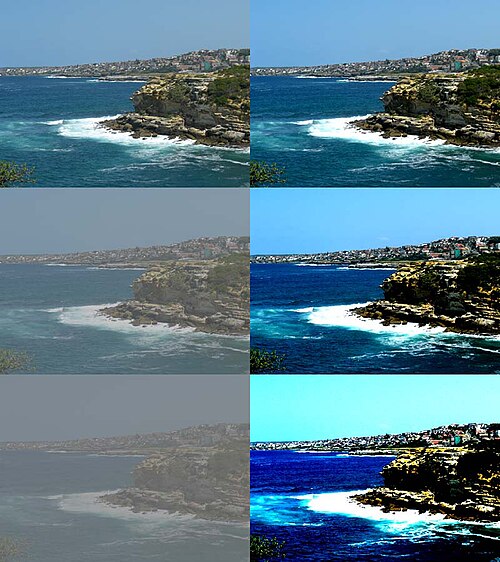
image: Wikimedia Commons, voir Wikimedia Commons, CC BY-SA 3.0
contrast
Perceptible difference between two neighboring areas.
color
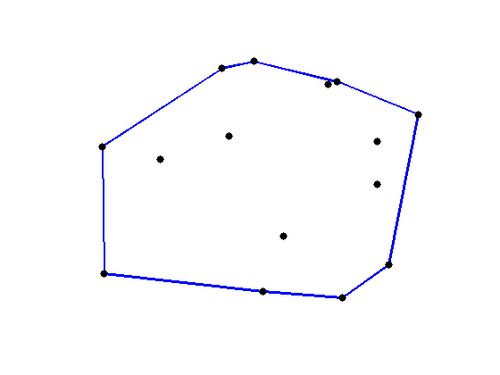
image: Wikimedia Commons, Fede Threepwood, Public domain
convex hull
Smallest convex polygon containing a set of points.
encoding
coordinate system
Geometric frame that places the marks.
encoding
coordinated multiple views
Several views of one dataset reacting together.
interaction
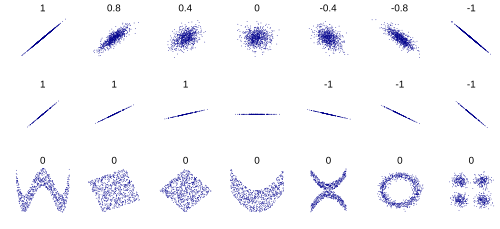
image: Wikimedia Commons, DenisBoigelot, original uploader was Imagecreator, CC0
correlation
Measure of the presence and the extent of a mutual relationship between two variables.
statistics
correlation coefficient
Normalized measure of association between two variables.
statistics
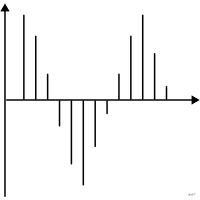
correlogram
Autocorrelation of a series plotted against the lag.
chart, lines and areas
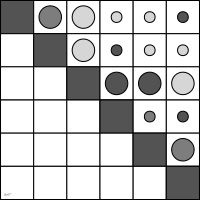
corrgram
Colored matrix of correlation coefficients between every pair of variables.
chart, matrices and tables
count
Number of observations in a category.
data
covariation
“The tendency for the values of two or more variables to vary together in a related way”
statistics
crispness
Degree of blur of the edges and fill of a mark.
encoding
cross-filtering
Filter applied in one view that restricts all the others.
interaction
curvature
Degree of bending of a line mark encoding a magnitude.
encoding
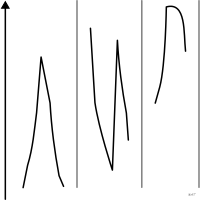
cycle plot
Time series split by phase of the cycle to separate trend from seasonality.
chart, lines and areas
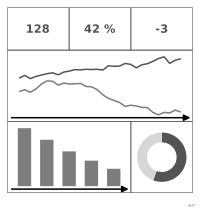
dashboard
Set of summary views monitored over time.
process
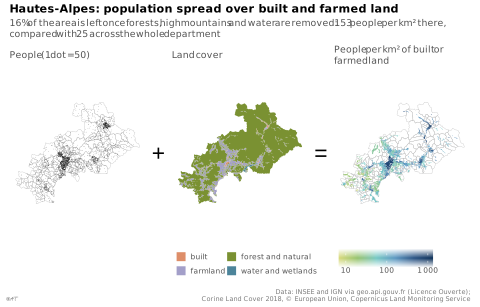
dasymetric map
“A technique in which attribute data that is organized by a large or arbitrary area unit is more accurately distributed within that unit by the overlay of geographic boundaries that exclude, restrict, or confine the attribute in question.”
map, maps
data art
Artwork using data as its material.
process
data cleaning
Correction of errors, duplicates and inconsistencies.
process
data density
Amount of information displayed per unit of area.
critique
data journalism
Journalism grounded in the analysis and display of data.
process
data physicalization
Physical artifact whose geometry or material encodes data.
encoding
data provenance
Documented history of the transformations applied to the data.
data
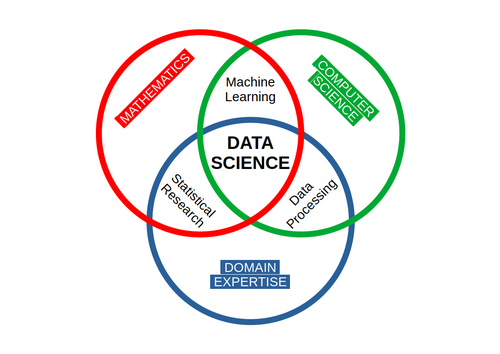
image: Wikimedia Commons, Максим Пе, CC BY-SA 4.0
data science
Field combining statistics, computing and an application domain.
process
data source
Declared origin of the data used.
data
data storytelling
Building a narrative that guides the reader through the data.
process
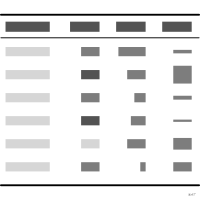
data table
Presentation of exact values in rows and columns.
chart, matrices and tables
data validity issues
Data quality flaw ignored or wrongly invoked to support a conclusion.
critique
data visualization
Graphical representation of data meant to reveal its structure.
process
data wrangling
Shaping data before analysis or visualization.
process
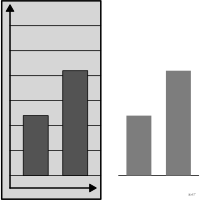
data-ink ratio
Share of ink devoted to information out of total ink.
critique
dataset
Structured set of observations and variables.
data
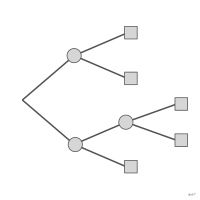
decision tree
Tree that chains choices and uncertain events, from the root to the leaves, up to the possible outcomes of each path.
chart, networks and trees
decoding
Process by which a reader recovers a value from the chart.
encoding
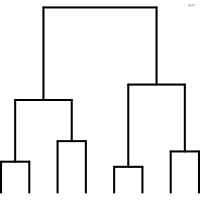
dendrogram
Tree showing a hierarchical classification.
chart, networks and trees
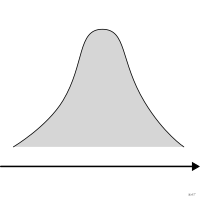
density plot
Smoothed estimate of a continuous variable's distribution.
chart, lines and areas
dependent variable
Variable whose values change according to the independent variable.
data
depth
Position of a mark along the viewing axis of a three-dimensional scene.
encoding
depth perception
Ability to judge the distance and relief of objects from visual cues.
perception
descriptive statistics
Methods that summarize and describe data with summary measures, tables and graphs.
statistics
design critique
Collective review of a figure before publication.
process
details on demand (interaction)
Detail shown only when the reader asks for it.
interaction
detrending
Removing the long-term trend of a time series to bring out its deviations.
statistics
developable surface
Surface (plane, cylinder or cone) that unrolls flat without distortion and onto which the globe is projected.
map
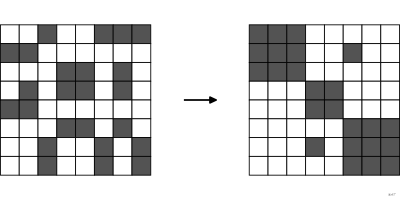
diagonalization
Reordering the rows and columns of a matrix until its structure appears.
process
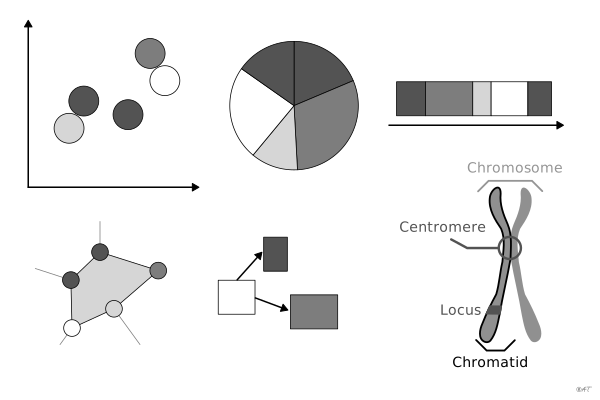
diagram
Construction in which “the correspondences in the plane can be established between all the elements of one component and all the elements of another component” (Bertin, translated).
chart
dimension reduction
Projection of data with many correlated variables onto a few key dimensions.
statistics
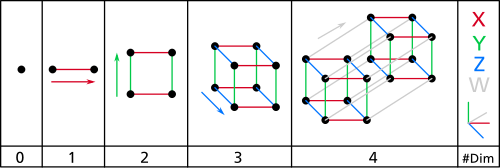
image: Wikimedia Commons, NerdBoy1392, CC BY-SA 3.0
dimensionality
Number of variables describing each observation.
data
direct labeling
Series name placed on the series itself rather than in a legend.
encoding
discrete variable
Variable taking only countably many values.
data
dissociative variable
Visual variable that changes the visibility of signs and prevents perceiving them all equally.
encoding
distortion (interaction)
Enlarging part of the view at the expense of the rest which stays visible.
interaction
distribution
Spread of counts over the possible values.
statistics
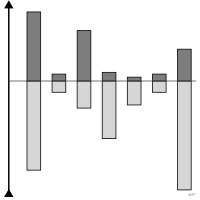
diverging bar chart
Bars running up or down from a reference line according to sign.
chart, bars
diverging palette
Two-branch palette around a pivot value.
color
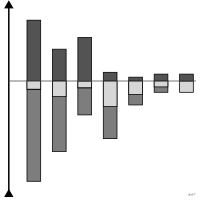
diverging stacked bar chart
Stacked bars whose segments extend either side of a baseline.
chart, bars
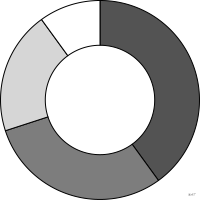
donut chart
Pie chart with a hole in the middle.
chart, sectors, tilings and units
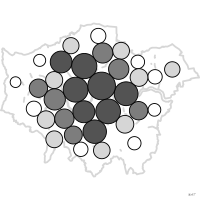
Dorling cartogram
Cartogram where each unit becomes a proportional circle.
map, maps
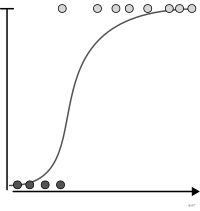
dose-response curve
Curve of the measured response as a function of the administered dose.
chart, lines and areas
dot density map
Scattered dots whose count encodes a total.
map, maps
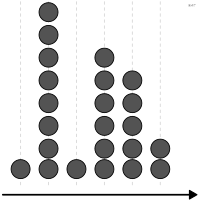
dot plot
Distribution in which each observation is a dot stacked above its value.
chart, points and bubbles
dots per inch
Unit of resolution in printing.
process
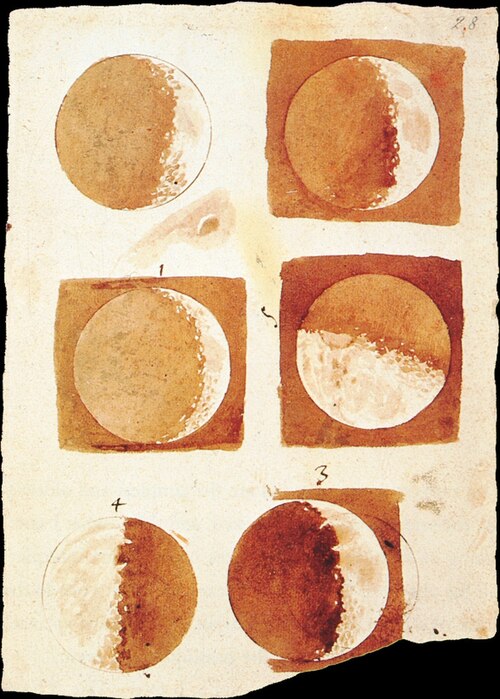
image: Wikimedia Commons, Galileo Galilei, Public domain
drawing
Image drawn by hand or by computer without relying on data.
figure, non-chart figures
drill-down
Moving from an aggregated level to a finer one.
interaction
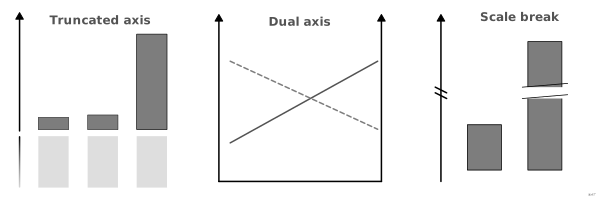
dual axis
Two different vertical scales in the same chart.
critique
dual coding
Reinforcement of information through two distinct channels.
perception
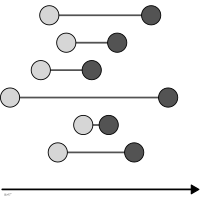
dumbbell chart
Two joined dots showing the gap between two states.
chart, points and bubbles
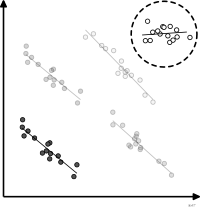
ecological fallacy
Conclusion about individuals drawn from aggregated data.
critique
effect size
Measure of an effect's magnitude independent of sample size.
statistics
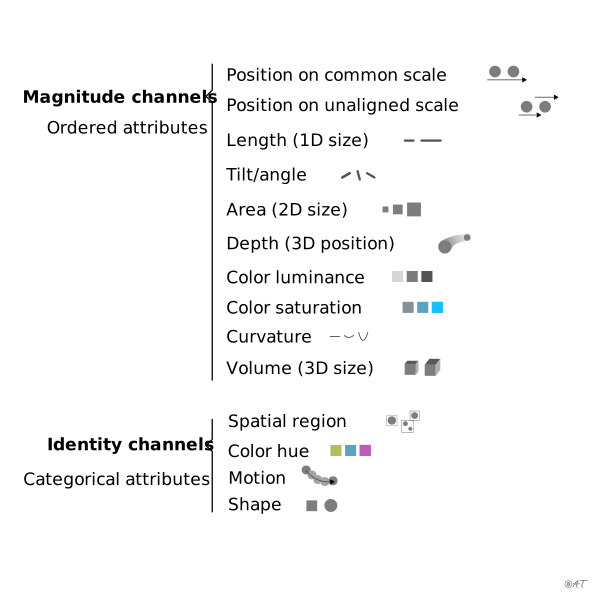
effectiveness principle
The most important attributes are encoded with the most salient channels.
encoding
efficiency
Quality of a construction answering a question correctly in a shorter observation time than another.
critique
eigenvalue
Amount of variance carried by an ordination axis.
statistics
elementary reading
Question bearing on a single element: at this date what is the value?
perception
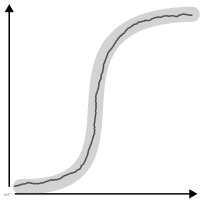
empirical cumulative distribution function
Curve giving the share of observations below each value.
chart, lines and areas
enclosure
A shared frame creates a group.
perception
Equal Earth projection
Pseudocylindrical equal-area projection designed in 2018 after the look of the Robinson projection.
map
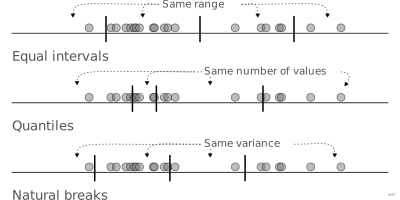
equal interval classification
Classification into classes spanning equal ranges of values.
map
equal-area projection
Projection preserving area ratios at the cost of shape.
map
error bar
Segment showing the spread or uncertainty of an estimate.
statistics
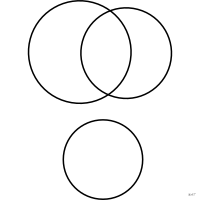
Euler diagram
Sets where only the actual intersections are drawn.
chart, sets
explanatory visualization
Visualization made to convey an identified message.
process
exploratory data analysis
Graphical examination of data without strong prior hypotheses.
process
exploratory visualization
Visualization made to discover structure for oneself.
process
expressiveness principle
Principle that “the visual encoding should express all of, and only, the information in the dataset attributes”.
encoding
external identification
Reading step where the observer recognizes what the graphic is about.
perception
extract (interaction)
Retrieval of a data subset together with its query parameters.
interaction
extrapolation
Projection of the data beyond the known points.
statistics
facet
Sub-chart obtained by splitting the data by a variable.
encoding
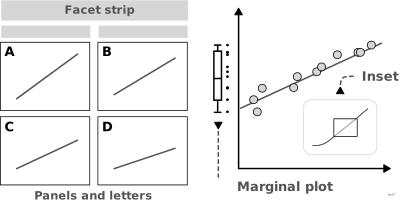
faceting
Splitting a chart into small multiples by a variable.
encoding
factor loading
Weight of a variable in the construction of an axis.
statistics
failure to account for statistical nuance
Conclusion ignoring a statistical subtlety such as the lack of a control group.
critique
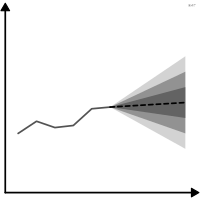
fan chart
Forecast surrounded by widening uncertainty bands.
chart, lines and areas
figuration
Construction that must be read shape by shape because it does not fit into a single image.
perception
figure numbering
Figure referencing allowing them to be called out in the text.
process
figure title
Text announcing what a figure is about.
process
fill
Interior color of an area mark.
encoding
filtering (interaction)
Reducing the display to the selected observations.
interaction
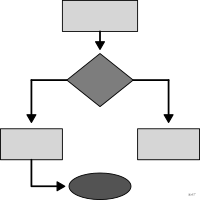
flow chart
Diagram of the steps and decisions of a process.
chart, networks and trees
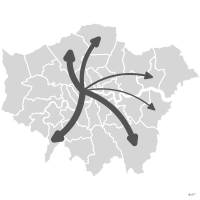
flow map
Map showing directed movement between places.
map, maps
focus indicator
Visual mark showing which element receives keyboard input.
interaction
font
A typeface in a given size and style.
typography
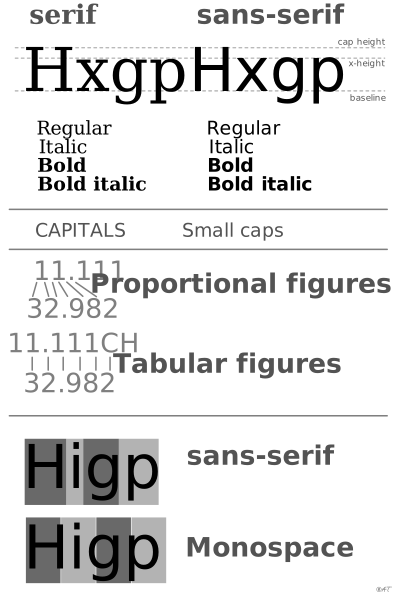
font weight
Stroke thickness of a typeface.
typography
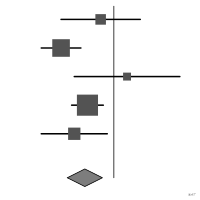
forest plot
Effects and confidence intervals of several studies aligned.
chart, points and bubbles
frequency framing
Expressing a probability as a number of cases out of a total.
statistics
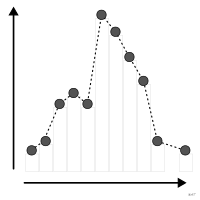
frequency polygon
Distribution drawn as a line joining the tops of the bins.
chart, lines and areas

funnel chart
Successive steps of a process with a shrinking population.
chart, bars
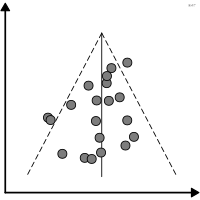
funnel plot
Effect against precision used to detect publication bias.
chart, points and bubbles
Gall-Peters projection
Cylindrical equal-area projection with standard parallels at 45 degrees.
map
gamut
Set of colors a device can reproduce.
color
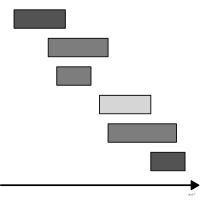
Gantt chart
Horizontal bars placing tasks along a timeline.
chart, timelines
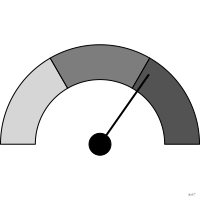
gauge chart
Circular dial showing a single value.
critique
geographic information system
System for managing and analyzing located data.
map
geometric symbol
Graphic symbol made of a point, a line, an area, a surface or a volume.
encoding
geometry
Type of mark used to represent the observations.
encoding
geospatial data
Data tied to a position on the Earth.
data
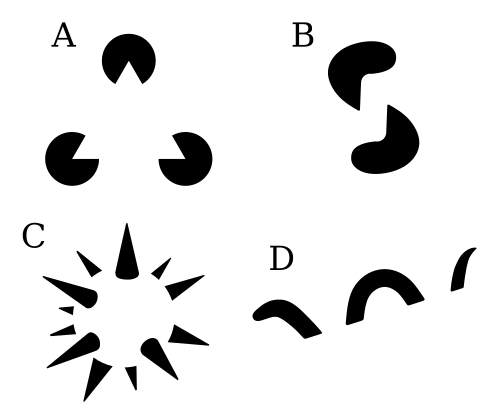
image: Wikimedia Commons, Mrmw, CC0
Gestalt principles
Rules describing how the eye groups visual elements.
perception
gist
Mental overview of a scene maintained despite eye movements.
perception
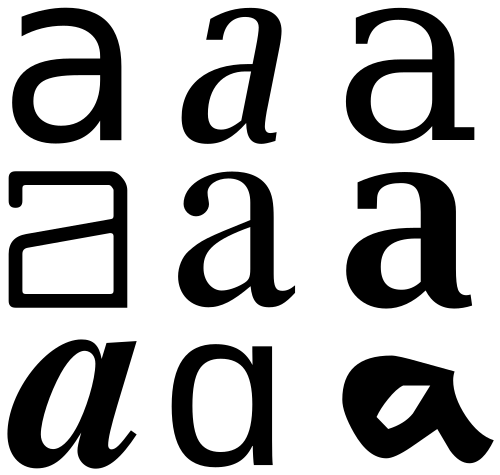
image: Wikimedia Commons, Wickey-nl, CC0
glyph
Small composite shape encoding several variables at once.
encoding
Goode homolosine projection
Interrupted equal-area projection joining the sinusoidal at low latitudes and the Mollweide at high latitudes.
map
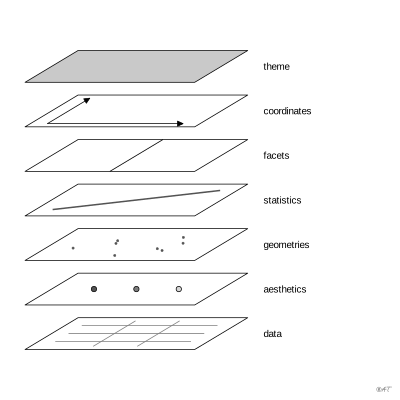
grammar of graphics
Framework decomposing a chart into data, scales, geometries and layers.
encoding
grand tour
Animation of a continuous sequence of low-dimensional projections of multivariate data.
interaction
granularity
Size of the repeated elements of a texture at equal ink density.
encoding
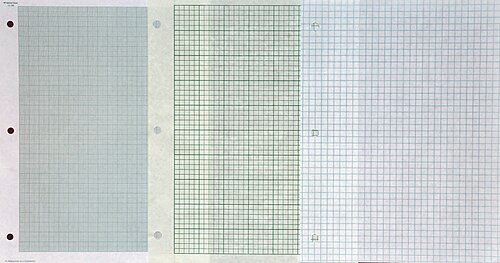
image: Wikimedia Commons, Mikus, CC BY-SA 4.0
graph paper
Paper printed with a regular grid for plotting data by hand.
process
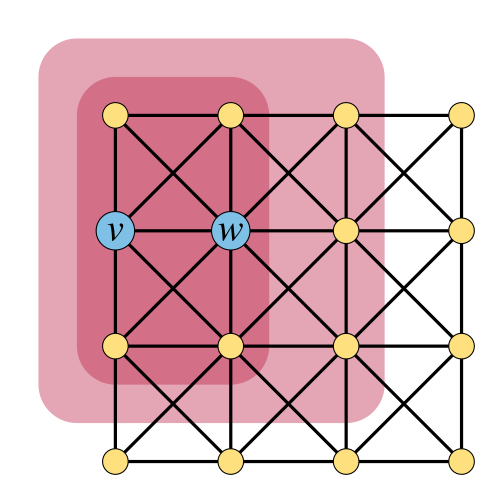
image: Wikimedia Commons, David Eppstein, CC0
graph theory
Branch of mathematics studying sets of vertices joined by edges.
statistics
graphic density
Number of signs relative to the available area.
critique
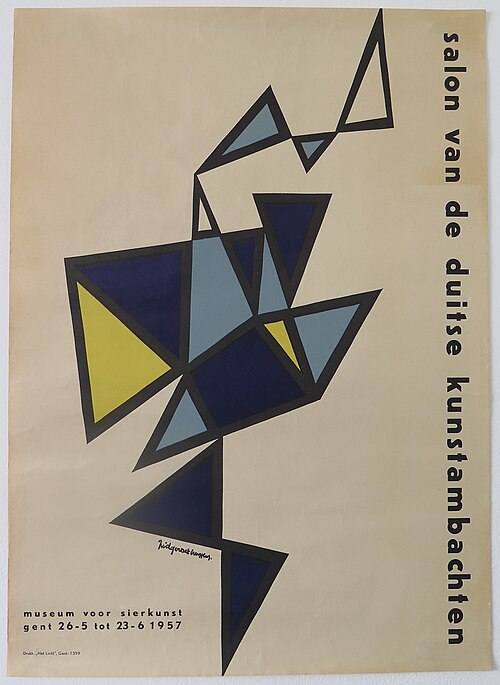
image: Wikimedia Commons, Burssens, CC BY-SA 4.0
graphic design
Design of the visual form of a message.
process
graphic processing
Reworking a graphic until it answers the question asked.
process
graphicacy
Ability to read and produce graphical representations.
perception
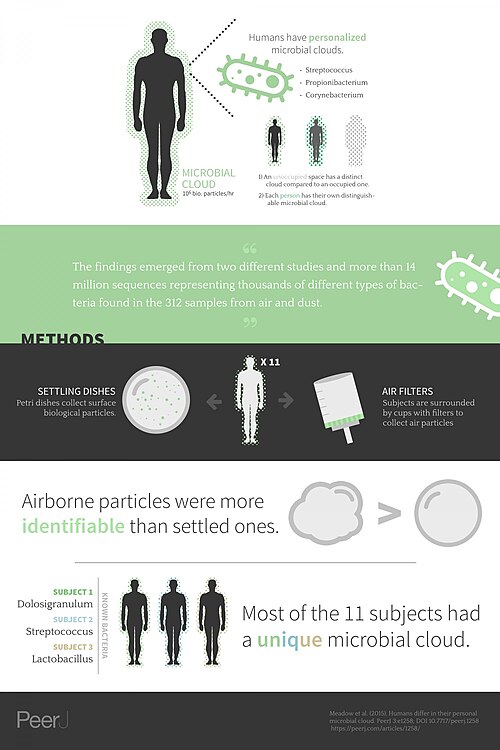
image: Wikimedia Commons, Meadow JF, Altrichter AE, Bateman AC, Stenson J, Brown G, Green JL, Bohannan BJM. 2015. Humans differ in their personal microbial cloud. PeerJ 3:e1258 https://doi.org/10.7717/peerj.1258, CC BY 4.0
graphical abstract
Single figure summarizing the point of an article.
process
graphical integrity
Faithfulness of the representation to the magnitude of the data it displays.
critique
graphical perception
Study of how accurately graphical encodings are read.
perception
graticule
Network of meridians and parallels drawn on a map.
map
grayscale
Range of grays from black to white, without hue.
color
gridline
Background line helping to read values.
encoding
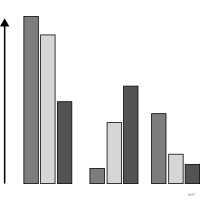
grouped bar chart
Bars juxtaposed within groups to compare several series.
chart, bars
guided tour
Tour that steers the sequence of projections toward those showing a sought-after structure.
interaction
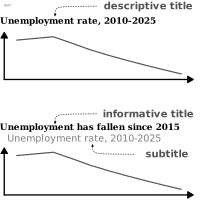
headline
Title stating the conclusion to draw from the chart rather than its topic.
process
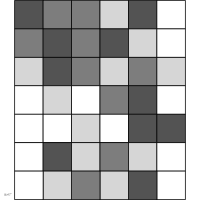
heatmap
Matrix whose cells are colored by value.
chart, matrices and tables
hexbin map
Spatial aggregation into hexagonal cells.
map, maps
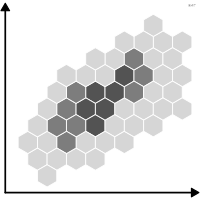
hexbin plot
Scatterplot whose plane is divided into hexagons shaded by the number of points.
chart, points and bubbles
hierarchical clustering
Grouping of observations into nested classes summarized by a dendrogram.
statistics
high-dimensional data
Data described by a large number of variables.
data
highlighting
Visual strengthening of a subset against the rest.
interaction
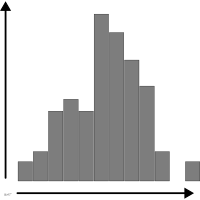
histogram
Distribution of a continuous variable split into bins.
chart, bars
history (interaction)
Log of user actions that supports undo and replay.
interaction
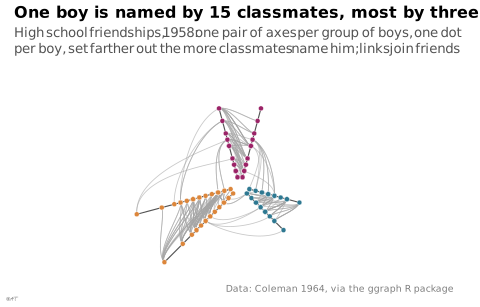
hive plot
Network whose nodes sit on radial axes according to their attributes.
chart, networks and trees
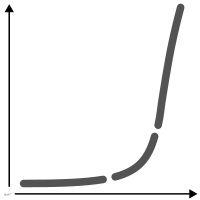
hockey stick chart
Long flat curve that bends sharply upward at the end of the series.
chart, lines and areas
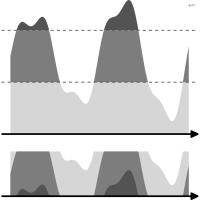
horizon chart
Time series folded into colored bands to save vertical space.
chart, lines and areas
HSL
Model describing color by hue, saturation and lightness.
color
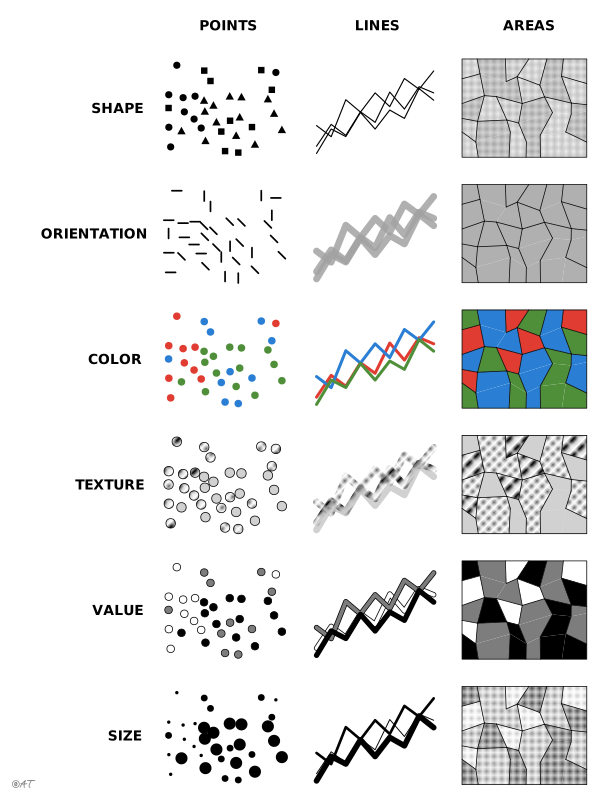
hue
Chromatic component perceived as red, blue, green and so on.
color
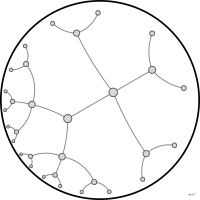
hyperbolic tree
Node-link tree drawn in hyperbolic geometry that enlarges the focus and squeezes the rest toward the edge of a disk.
chart, networks and trees
hypothetical outcome plot
Animation cycling through equally likely draws to show uncertainty.
statistics
icon
Small figurative image standing for a category or action.
encoding
iconic memory
Very brief visual memory, lasting a few hundred milliseconds, that holds an image just after it is seen.
perception
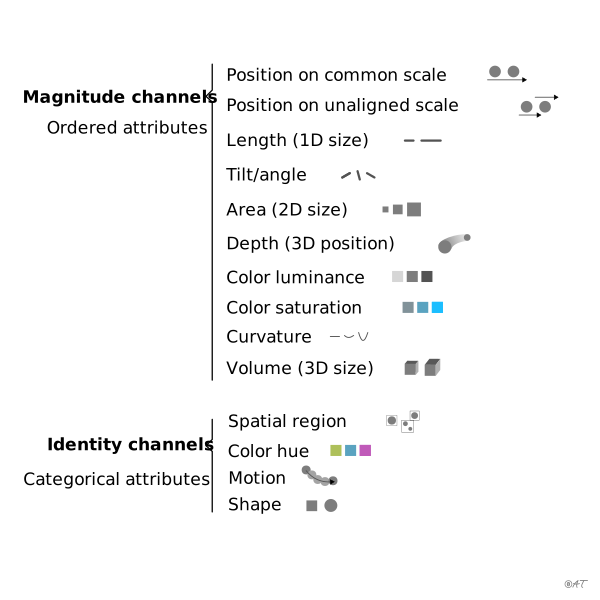
identity channel
Channel telling what something is or where it is suited to categorical attributes.
encoding
image
“Meaningful visual form perceived in an instant of perception (in a single glance)” (Bertin, translated).
perception
implantation
Geometric nature of the sign in Bertin: point, line or area.
encoding
imposition
Bertin's use of the plane: diagram, network, map or symbol.
encoding
incorrect reading of chart
Misreading induced by a flaw in the design of the chart.
critique
independent variable
Variable that is varied and does not depend on the other data in the chart.
data
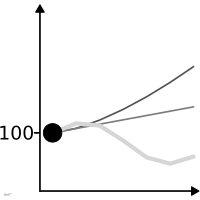
index number
Series rescaled to 100 at a reference date.
data
induction
The reader's ability to draw far more from a graphic than the information deliberately put into it.
perception
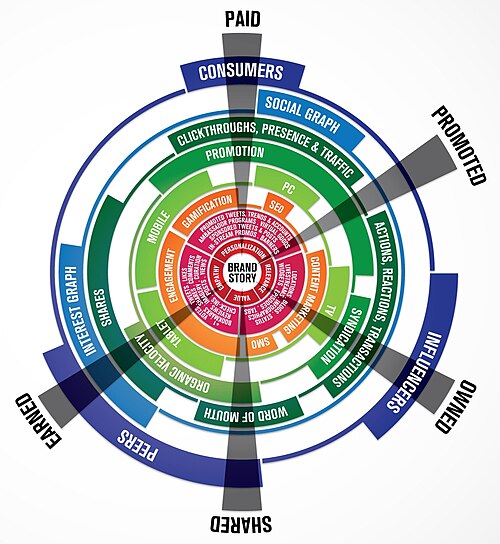
image: Wikimedia Commons, Brian Solis and JESS3, CC BY 2.0
infographic
Graphic composition combining data, text and illustration.
process
information design
Design of artifacts that make information understandable.
process
information visualization
Visual representation of abstract non-spatial data.
process
inset
Small chart inserted inside a larger one.
encoding
insight need
Question a visualization must help answer.
process
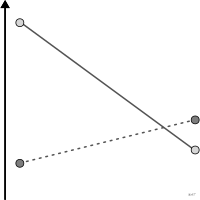
interaction plot
Effect of one factor drawn separately for each level of another.
chart, lines and areas
interactivity
Ability for the reader to act on the representation.
interaction
internal identification
“Stage of the reading process during which the observer recognizes on the drawing the visual variables assigned to the components of the information” (Bertin, translated).
perception
interpolation
Estimating a value that falls between two known points.
statistics
interquartile range
Difference between the third and first quartiles, spanning the middle half of the values.
statistics
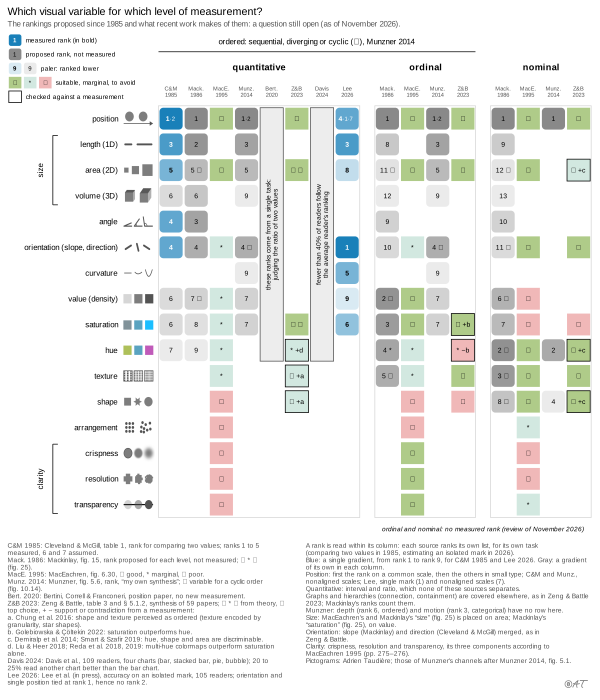
interval scale
Measurement with constant spacing but no absolute zero.
data
invariant
Notion common to all the data of a graphic and stated in the title.
encoding
inventory
Graphic representation recording the information exhaustively.
process
inverted axis
Axis running in reverse so that a rise reads as a fall.
critique
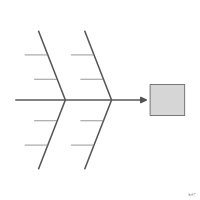
Ishikawa diagram
Fish-skeleton diagram that sorts the possible causes of an effect into categories, drawn as slanted bones along a central spine leading to the effect.
chart, networks and trees
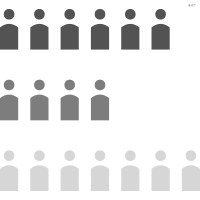
ISOTYPE
Neurath's standardized pictogram system for statistics.
encoding
iteration
Successive rework of a figure from feedback.
process
jitter
Small random displacement of points to avoid overlap.
encoding
just-noticeable difference
Smallest detectable difference between two stimuli.
perception
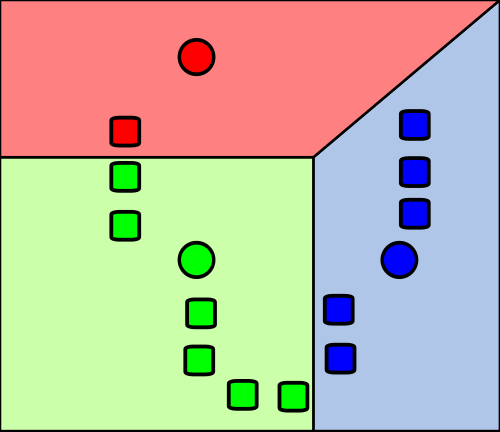
image: Wikimedia Commons, Weston.pace, CC BY-SA 3.0
k-means
Partitioning into k classes that minimizes the distance of each observation to its class center.
statistics
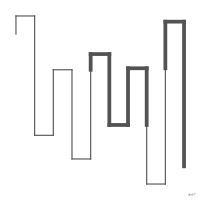
kagi chart
Price chart without a time scale, drawn as a vertical line that turns back only when the price retraces by more than a preset amount.
chart, lines and areas
kerning
Adjustment of space between two adjacent characters.
typography
keyboard navigation
Browsing and operating a visualization with the keyboard alone.
interaction
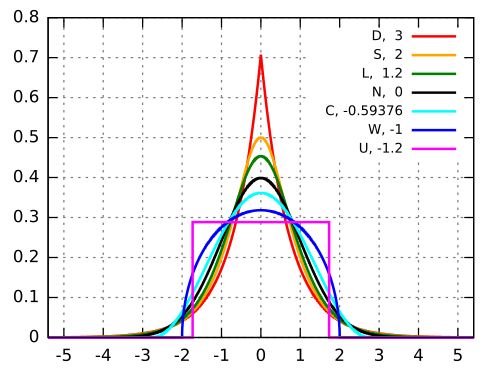
image: Wikimedia Commons, Original: MarkSweep Vector: Andel, Public domain
kurtosis
Weight of a distribution's extreme values.
statistics
label
Text identifying an element of the chart.
encoding
Lambert conformal conic projection
Conformal conic projection, common for mid-latitude regions that extend east to west.
map
layer
Set of marks stacked on the previous ones in a chart.
encoding
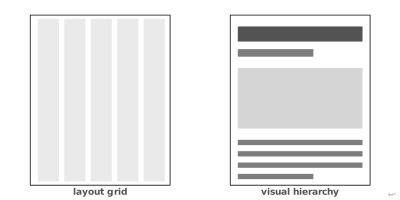
layout grid
Invisible framework aligning the elements of a layout.
typography
leader line
Thin line joining a label to the element it names.
encoding
leading
Vertical space between successive baselines.
typography
learning objective
Statement of what the viewer should be able to do or feel after reading the visualization.
process
legend
Lookup table between graphical codes and categories.
encoding
legend toggle
Clickable legend hiding or revealing series.
interaction
legibility
Ability of a construction to let its signs be separated.
critique

length
Linear extent of a mark encoding a quantity.
encoding
length of a component
Number of distinct categories a component holds.
encoding
level of organization
Perceptual property of a visual variable: selective, ordered or quantitative.
encoding
level of reading
“Number of correspondences involved in an instant of perception” (Bertin, translated).
perception
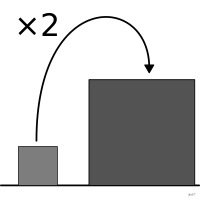
lie factor
Ratio of the visual effect shown to the effect in the data.
critique
lightness
Position of a color between black and white.
color
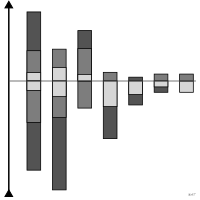
Likert chart
Ordered responses split either side of a neutral point.
chart, bars
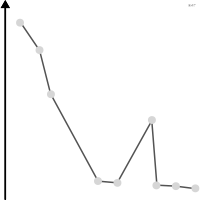
line chart
Points joined by a line to show an ordered progression.
chart, lines and areas
line type
Line pattern such as solid, dashed or dotted.
encoding
linear discriminant analysis
Method that seeks the linear combinations of variables that best separate known groups.
statistics
linear regression
Fitting a line minimizing squared deviations.
statistics
linguistic symbol
Graphic symbol made of text, numerals or punctuation marks.
encoding
local tour
Tour that explores the projections close to a starting projection.
interaction
locator map
Simple map showing where the place discussed in the text lies.
map, maps
LOESS
Smoothing by successive local regressions.
statistics
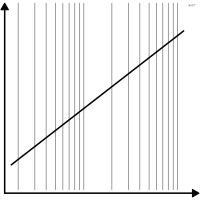
logarithmic scale
Scale where a constant distance means a constant ratio.
encoding
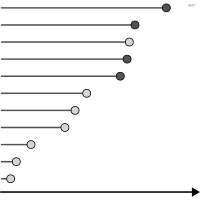
lollipop chart
Thin stem topped by a dot replacing the bar.
chart, bars
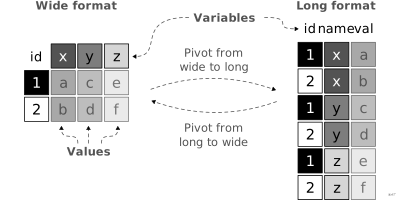
long format
Table where measured variables are stacked into one column.
data
long-term memory
Durable store of knowledge that gives meaning to what is perceived.
perception
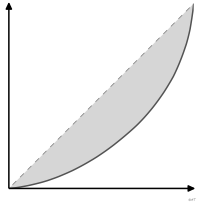
Lorenz curve
Curve giving, for each cumulative share of the population, the cumulative share of a quantity it holds, such as income.
chart, lines and areas
lossless compression
Image compression restoring the original pixel for pixel.
process
lossy compression
Image compression degrading the original to reduce file size.
process
luminance
Perceived amount of emitted light independent of hue.
color
magnitude channel
Channel perceived as ordered, suited to ordinal and quantitative attributes.
encoding
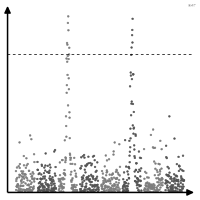
Manhattan plot
Significance of thousands of tests laid out along a genomic position.
chart, points and bubbles
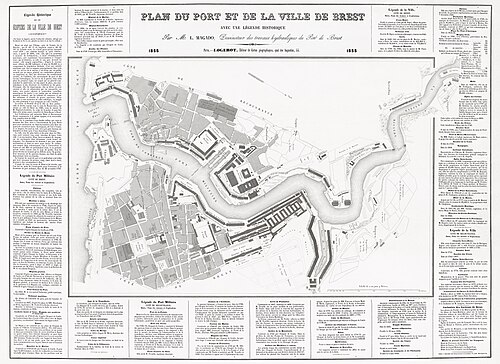
image: Wikimedia Commons, L. Magado (Dessinateur des travaux hydrauliques du port de Brest), Public domain
map
Construction in which “the correspondences in the plane are established between the elements of a geographic component arranged in the observed geographic order” (Bertin, translated).
map, maps
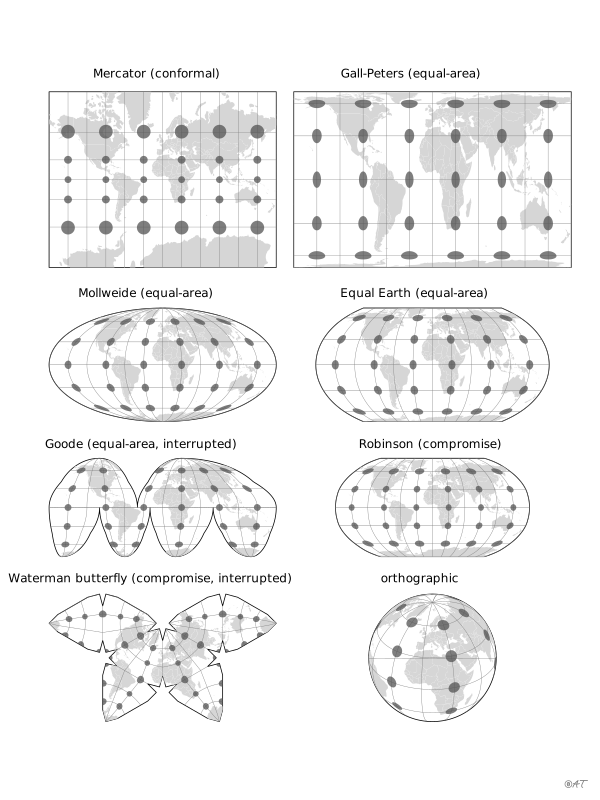
map projection
Transformation of the globe onto a flat surface.
map
margin
Space reserved around the plotting area.
encoding
margin of error
Half-width of an estimate's confidence interval.
statistics
marginal plot
Small plot along the margin of a main plot showing the distribution of one of its variables.
encoding
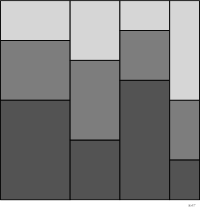
Marimekko chart
Rectangles whose width and height encode two proportions.
chart, sectors, tilings and units
mark
Basic geometric element of a chart.
encoding
mean
Sum of values divided by their count.
statistics
measure
Width of a column of text.
typography
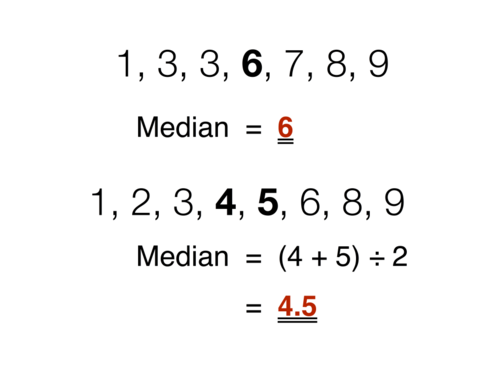
image: Wikimedia Commons, Blythwood, CC BY-SA 4.0
median
Value splitting the series into two equal halves.
statistics
memorability
Ease with which a figure stays in memory after being seen.
perception
Mercator projection
Conformal projection that greatly inflates high latitudes.
map
message
“Memorable graphic representation” (Bertin, translated).
process
metadata
Data describing the data itself.
data
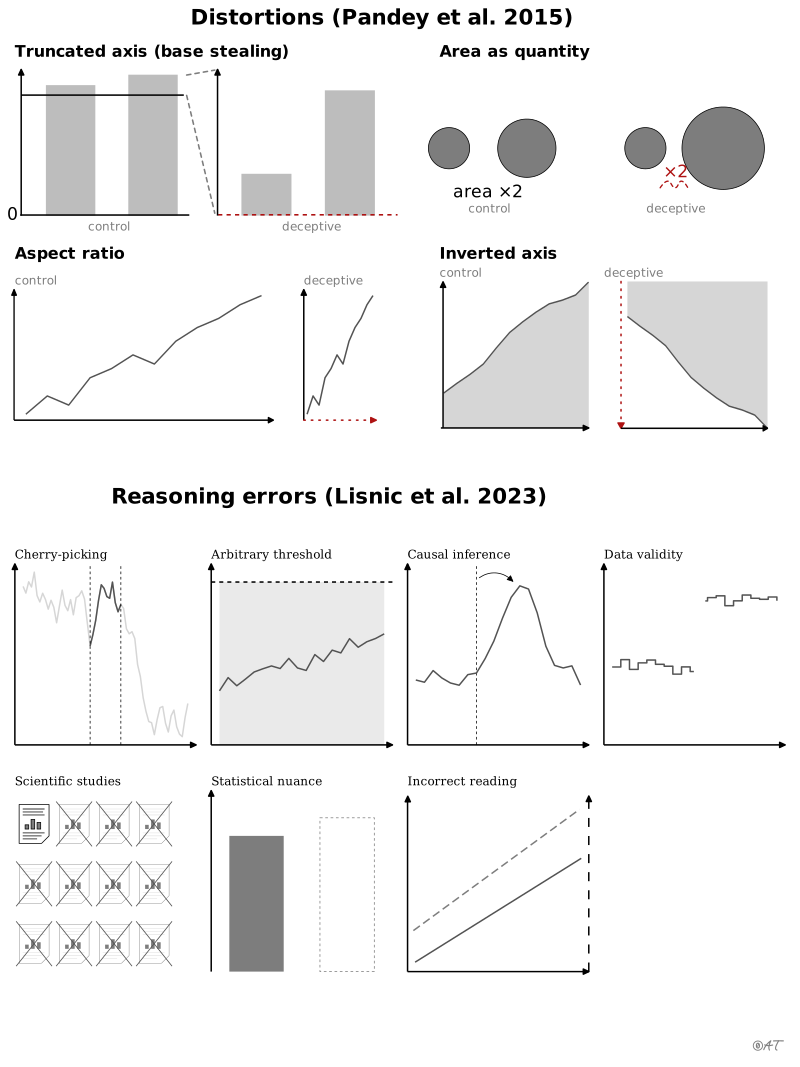
misleading chart
Chart whose form leads to a false reading of the data.
critique
misrepresentation of scientific studies
Study invoked for a conclusion it does not support.
critique
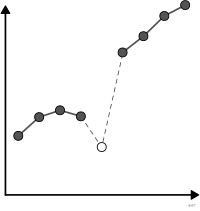
missing data
Absent values that must be shown rather than hidden.
data
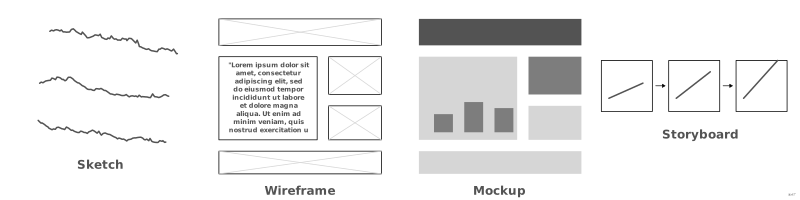
mockup
Faithful representation of the final rendering before build.
process
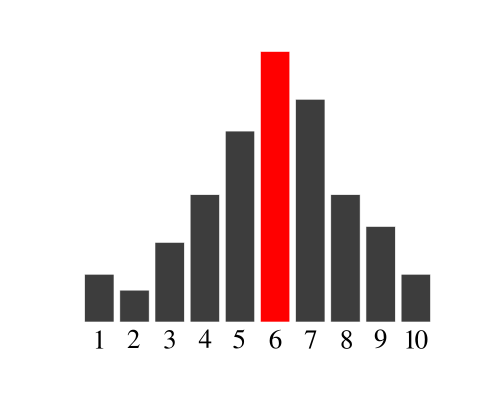
image: Wikimedia Commons, Joxemai, CC BY-SA 3.0
mode
Most frequent value.
statistics
model in the data space
Approach that shows a fitted model in the data space itself rather than through its summaries alone.
process
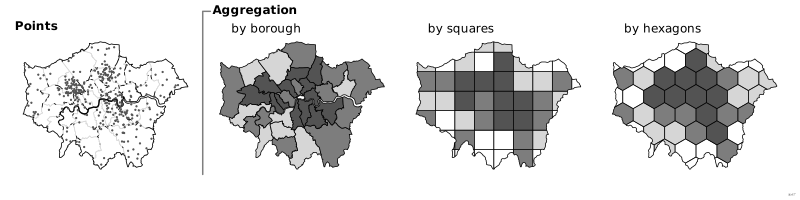
modifiable areal unit problem
Dependence of results on the chosen spatial partition.
critique
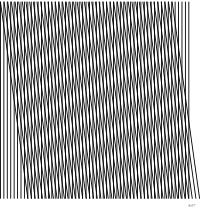
moiré effect
Spurious vibration produced by over-regular patterns.
critique
Mollweide projection
Elliptical equal-area projection common for thematic world maps.
map
monosemic graphic
Transcription of relationships between previously defined concepts.
encoding
monospaced typeface
Typeface where all characters share the same width.
typography
motion
Movement of a mark over time used as a visual variable.
encoding
motion parallax
Depth cue in which, as the viewer moves, near objects seem to move faster than far ones.
perception
moving average
Average computed over a sliding window.
statistics
multifunctioning graphical element
Element that fills several roles at once instead of just one.
encoding
natural breaks
Classification placing breaks so as to minimize variance within classes.
map
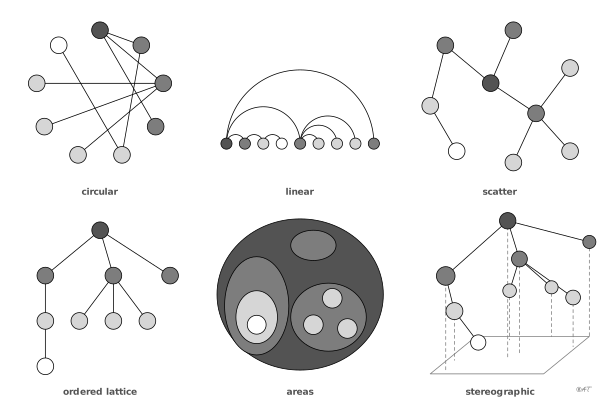
network
Construction in which “the correspondences in the plane can be established between all the elements of one and the same component” (Bertin, translated).
chart
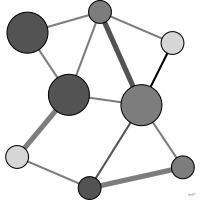
network diagram
Nodes joined by links representing relationships.
chart, networks and trees
nominal scale
Measurement by plain unordered categories.
data
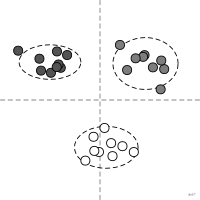
non-metric multidimensional scaling
Ordination preserving only the rank order of distances between objects.
statistics
nonlinear dimension reduction
Dimension reduction that can unfold a curved structure instead of projecting it.
statistics
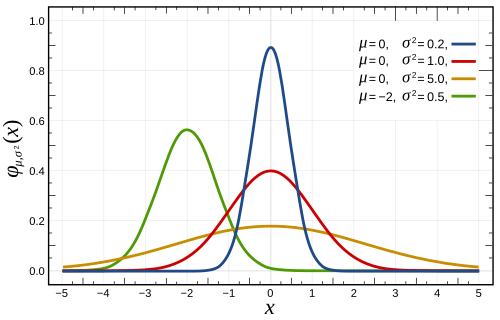
image: Wikimedia Commons, Inductiveload, Public domain
normal distribution
Symmetric bell-shaped distribution.
statistics
normalization
Bringing values to a common base to make them comparable.
data
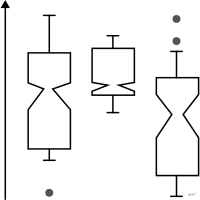
notched box plot
Box hollowed by a notch showing the uncertainty around the median.
chart, boxes and densities
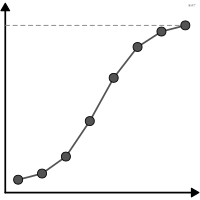
ogive
Polygon joining the cumulative frequencies at the upper class limits.
chart, lines and areas
OKLCH
Perceptually uniform color space described by lightness, chroma and hue.
color

onion diagram
Set diagram of concentric circles in which each set lies strictly inside the one around it, from the most general to the most specific.
chart, sets
ordered variable
Visual variable whose categories order themselves spontaneously.
encoding
ordinal data
Categories with an order but no measurable spacing.
data
ordinal scale
Measurement by ordered categories without measurable spacing.
data
ordination
Projection of objects described by many variables into a low-dimensional space.
chart, points and bubbles
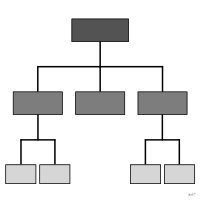
organizational chart
Tree of reporting lines within an organization.
chart, networks and trees
orientation
Tilt of a mark distinguishing categories.
encoding
original correspondence
“Meeting point of the elements of several components” (Bertin, translated).
encoding
orthographic projection
Projection showing the globe as seen from an infinitely distant point.
map
outlier
Observation far removed from the rest of the distribution.
statistics
overall reading
Question reducing the whole information to a single answer: what was the general trend?
perception
overplotting
Marks hiding one another in dense regions.
critique
overview first zoom and filter details on demand
Recommended design sequence for interactive exploration.
interaction
p-value
Probability of a result at least as extreme under the null hypothesis.
statistics
panel
Plotting area of a sub-chart.
encoding
panel label
Letter identifying one panel within a composite figure.
encoding
panning
Moving the viewport without changing scale.
interaction
pansemic graphic
The system opens onto any meaning.
encoding
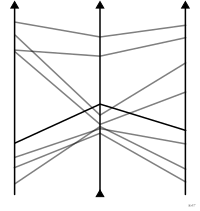
parallel coordinates
Parallel axes crossed by one polyline per observation.
chart, lines and areas
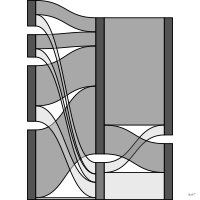
parallel sets
Flows between the categories of several categorical variables.
chart, flows
parallelism
Placing comparable elements side by side so the comparison makes itself.
encoding
pattern
Motif whose repetition makes up a texture.
encoding
pattern recognition
Detection of regularities in an image.
perception
per capita
Related to the number of inhabitants.
data
percentage point
Unit of difference between two percentages.
data
percentile
Value below which a given percentage of observations fall.
statistics
perceptible step
Step of a visual variable that the eye can tell apart from its neighbor.
encoding
perceptually uniform
Palette where equal numeric steps look equally different.
color
peripheral vision
Vision outside the center of gaze that detects motion and contrast, but little detail.
perception
perspective projection
Projection of a three-dimensional scene onto a plane in which distant objects appear smaller.
map
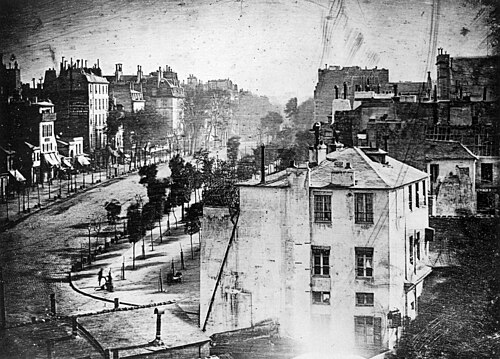
image: Wikimedia Commons, Louis Daguerre, Public domain
photograph
Image produced by a photographic process and reproduced as is.
figure, non-chart figures
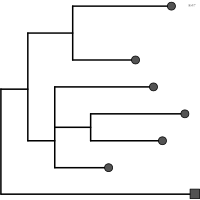
phylogenetic tree
Tree showing the kinship relationships between taxa.
chart, networks and trees
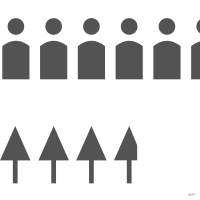
pictogram
Repeated or stylized icon encoding a quantity or category.
chart, sectors, tilings and units
pictorial symbol
Graphic symbol made of an image, an icon or a statistical glyph.
encoding
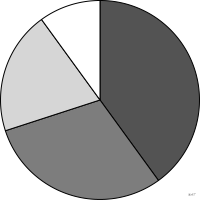
pie chart
Disc split into sectors proportional to parts of a whole.
chart, sectors, tilings and units
piling
Concentration of points at the center of a low-dimensional projection of high-dimensional data.
critique
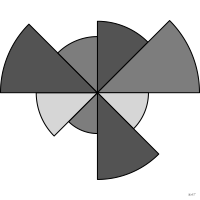
polar area chart
Equal-angle sectors whose radius encodes the value.
chart, radial
polar coordinates
Frame where position is given by an angle and a radius.
encoding
polysemic graphic
The system aims to define a concept or an idea but interpretations may diverge.
encoding
pop-out
Immediate standing out of a unique element in a set.
perception
population pyramid
Back-to-back bars comparing two groups by age class.
chart, bars

position
Location of a mark on a common scale.
encoding
position adjustment
Rule shifting overlapping marks to keep them readable.
encoding
position on unaligned scale
Location of a mark on a scale offset from those of the marks it is compared with.
encoding
preattentive processing
Immediate detection of some visual properties before focused attention.
perception
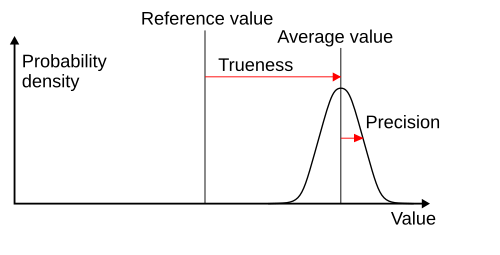
image: Wikimedia Commons, SV1XV, CC BY-SA 3.0
precision
Reproducibility of a measurement regardless of its correctness.
statistics
prediction interval
Interval expected to contain a future observation.
statistics
principal component analysis
Ordination seeking the axes that carry the most variance.
statistics
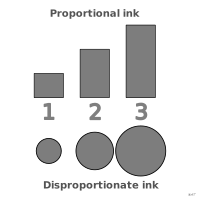
principle of proportional ink
The inked area representing a value must be proportional to that value.
critique
print output
Fixed medium imposing constrained resolution and color gamut.
process
progressive data analysis
Data analysis that delivers partial results of increasing quality while the computation runs.
process
projection (interaction)
Interactive change of the projection of multidimensional data onto the plane.
interaction
projection distortion
Alteration of angles, areas, distances or shapes that any projection of the globe onto a plane imposes.
map
projection pursuit
Search for low-dimensional projections that optimize an index of structure.
statistics
proportion
Fraction of a total.
data
proportional symbol map
Symbols sized by an absolute quantity at a location.
map, maps
proximity
Nearby elements are perceived as a group.
perception
psychophysics
Study of the link between physical and perceived magnitude.
perception
qualitative palette
Distinct unordered colors for categories.
color
quantile classification
Classification putting the same number of observations in each class.
map
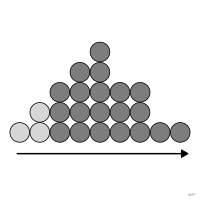
quantile dot plot
Probability distribution cut into a fixed number of quantiles each drawn as a dot.
chart, points and bubbles
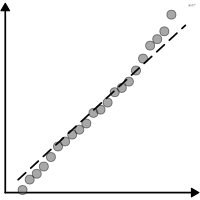
quantile-quantile plot
Comparison of observed quantiles to a theoretical distribution.
chart, points and bubbles
quantitative data
Measured data on which arithmetic is meaningful.
data
quantitative variable
Visual variable allowing a numeric ratio to be read between two marks.
encoding
quartile
Value splitting the distribution into four equal parts.
statistics
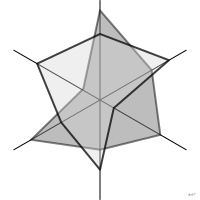
radar chart
Axes radiating from a center joined into a polygon.
chart, radial

radial bar chart
Bars laid out along a circular axis.
chart, radial
radial tour
Tour that varies the share of a single variable in the projection to judge its importance.
interaction
rainbow color map
Palette running through the whole spectrum to encode a quantity.
critique
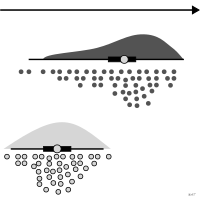
raincloud plot
Combination of a density, a box and the raw points.
chart, boxes and densities
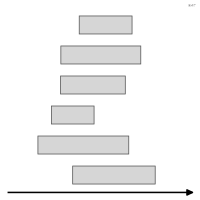
range bar chart
Bars that run, for each category, from a low value to a high value rather than from zero.
chart, bars
range of a quantitative series
“Ratio between the largest and the smallest number of the series” (Bertin, translated).
encoding
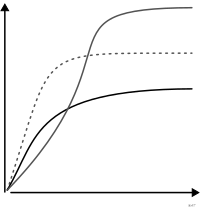
rarefaction curve
Expected richness as a function of sampling effort.
chart, lines and areas
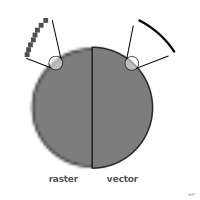
raster graphics
Image described by a grid of pixels.
process
rate
Count related to a reference population.
data
ratio scale
Measurement with an absolute zero allowing ratios.
data
raw data
Data as collected before any processing.
data
reasoning error
Logical flaw in the conclusion drawn from a chart, even a faithfully plotted one.
critique
reference line
Line marking a notable value such as a threshold or a mean.
encoding
reflow
Rearranging enlarged content so it stays readable without scrolling in two directions.
interaction
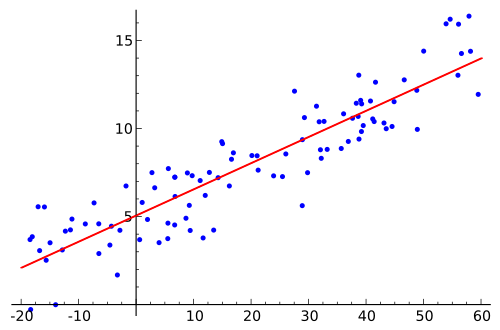
image: Wikimedia Commons, Sewaqu, Public domain
regression
Model estimating one variable from one or more others.
statistics
relational analysis
Analysis of the links between entities.
statistics
reproducibility
Ability to rebuild the figure from the data and the code.
process
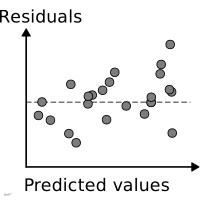
residual plot
Model residuals plotted against fitted values.
chart, points and bubbles
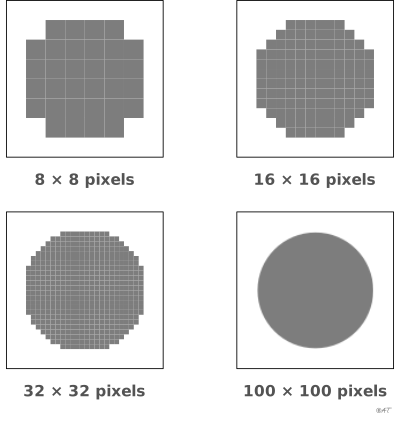
resolution
Pixel density of a raster image.
process
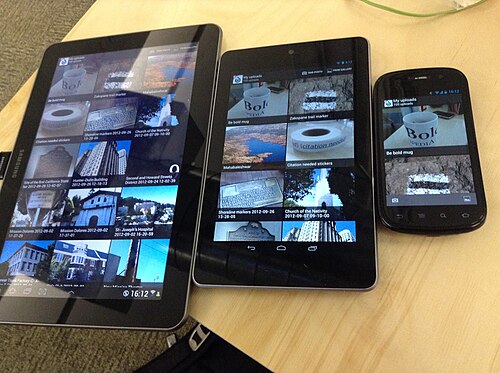
image: Wikimedia Commons, User:tfinc, CC BY-SA 3.0
responsive design
Adapting the layout to the screen size.
process
retina
Light-sensitive layer of the eye that converts light into nerve signals.
perception
retinal variable
Visual variable carried by the mark itself rather than by its location.
encoding
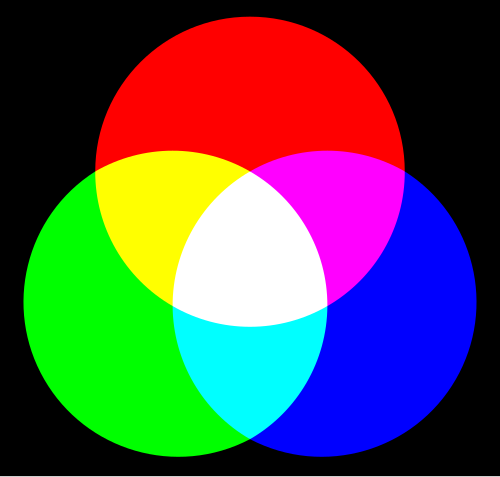
image: Wikimedia Commons, Quark67, CC BY-SA 3.0
RGB
Additive model used by screens.
color
ribbon
Area delimiting the uncertainty around a line.
encoding
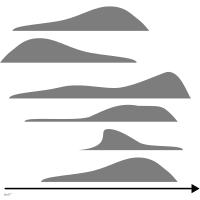
ridgeline plot
Vertically offset densities used to compare distributions.
chart, boxes and densities
Robinson projection
Compromise projection preserving neither angles nor areas but limiting both distortions.
map
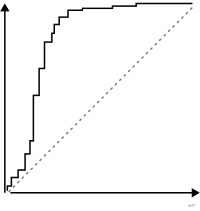
ROC curve
Sensitivity against false positive rate of a classifier.
chart, lines and areas
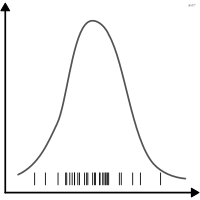
rug plot
Short ticks along the margin of a chart marking the observed values.
encoding
sage tour
Tour that spreads projected points radially to correct their piling at the center.
interaction
saliency
Ability of an element to attract the eye.
perception
sample size
Number of observations an estimate rests on.
statistics
sampling
Selection of a representative subset of a population.
statistics
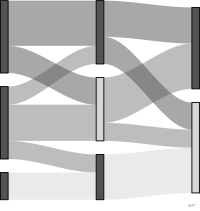
Sankey diagram
Flows whose width encodes a quantity conserved between stages.
chart, flows
sans serif
Letterforms without serifs.
typography
saturation
Intensity or purity of a color.
color
scagnostics
Numerical indices describing the shape of a scatterplot.
statistics
scale
Rule mapping data values to positions or colors.
encoding
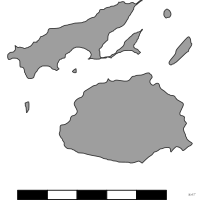
scale bar
Segment of known length placed on the image to give its scale.
encoding
scale break
Break in the axis to absorb an extreme value.
critique
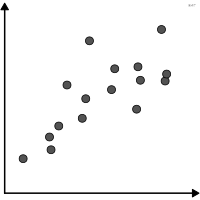
scatterplot
Points positioned by two quantitative variables.
chart, points and bubbles
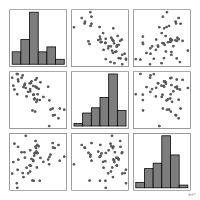
scatterplot matrix
Grid of all pairwise scatterplots.
chart, points and bubbles
schematic
Simplified depiction of an object or process that encodes no data.
figure, non-chart figures
scientific visualization
Visual representation of data with a physical spatial support.
process
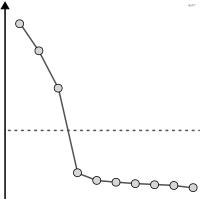
scree plot
Decreasing eigenvalues used to pick the number of axes.
chart, lines and areas
screen reader
Software rendering the content of a screen as speech or braille.
process
scrollytelling
Narrative whose steps trigger as the page scrolls.
interaction
search and locate (interaction)
Finding an item and highlighting its place in the view.
interaction
seizure risk
Hazard of a flash or red animation triggering an epileptic seizure.
critique
selectivity
Property of a visual variable that isolates a category at a glance.
perception
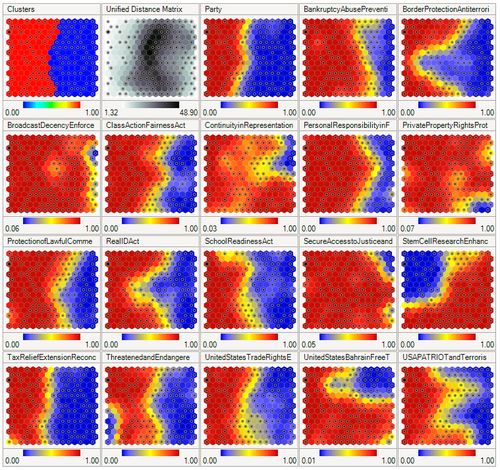
image: Wikimedia Commons, Original uploader was Denoir at en.wikipedia, CC BY-SA 2.5
self-organizing map
Neural network that places observations on a grid while preserving their neighborhoods.
statistics
semiology of graphics
Bertin's theory of how graphical signs work.
encoding
sequential palette
Ordered light-to-dark palette for a quantitative variable.
color
series
Sequence of related values within a table.
data
serif
Small terminal stroke on letterforms.
typography
shading
Continuous modulation of fill to suggest relief or intensity.
encoding
shape
Outline of a mark distinguishing categories.
encoding
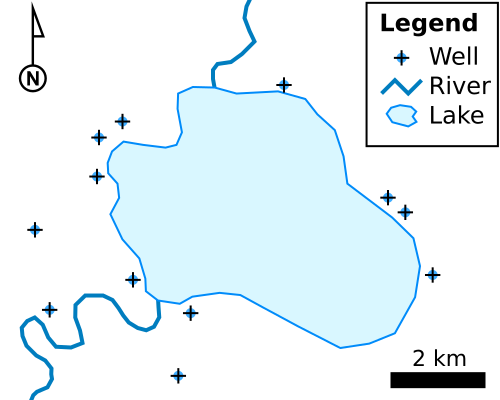
image: Wikimedia Commons, M. W. Toews, CC BY-SA 4.0
shapefile
Geographic vector file format.
data
signal-to-noise ratio
Share of useful information against distracting elements.
critique
significance asterisks
Asterisks marking the significance threshold a comparison reaches.
encoding
similarity
Similar elements are perceived as a group.
perception
simplification
Cutting the number of elements until the question asked finds its answer.
process
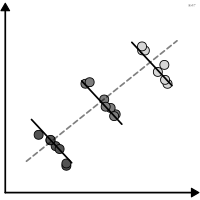
Simpson's paradox
Reversal of a trend depending on whether groups are aggregated.
critique
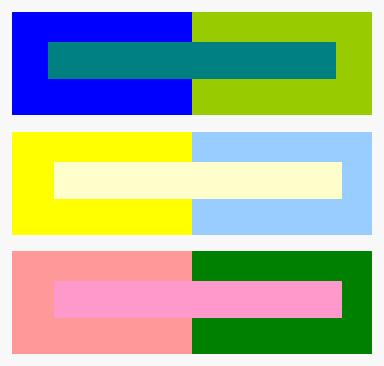
image: Wikimedia Commons, Monarey, CC0
simultaneous contrast
Shift in perceived color caused by its surroundings.
perception
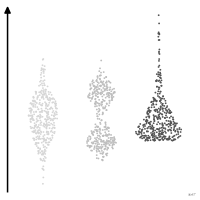
sina plot
Points of a distribution spread sideways in proportion to local density.
chart, points and bubbles
situational impairment
Temporary limitation caused by the context of use rather than by the person.
process
size
Dimension of a mark encoding a quantity.
encoding
sketch
Quick sketch exploring representation options.
process
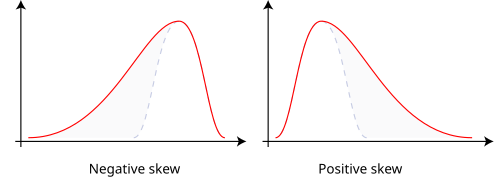
image: Wikimedia Commons, Rodolfo Hermans (Godot) at en.wikipedia., CC BY-SA 3.0
skewed distribution
Distribution with one tail stretching much further than the other.
statistics
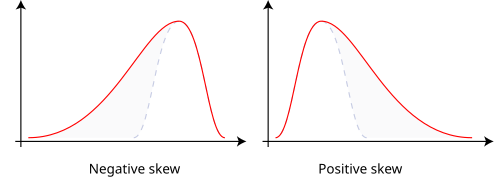
image: Wikimedia Commons, Rodolfo Hermans (Godot) at en.wikipedia., CC BY-SA 3.0
skewness
Imbalance of a distribution around its center.
statistics
slice tour
Tour that shows only the points near the projection plane to reveal the inside of shapes.
interaction
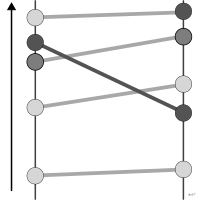
slopegraph
Two axes joined by segments showing change between two points.
chart, lines and areas
small caps
Capitals at lowercase height.
typography
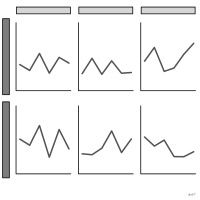
small multiples
Series of identical charts repeated across categories.
chart, composites
smoothing
Damping of short-term variation to reveal the trend.
statistics
sonification
Rendering of data as sound rather than as images.
encoding
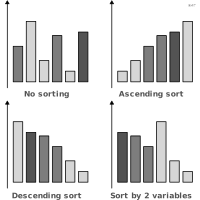
sorting
Ordering categories by value rather than alphabetically.
encoding
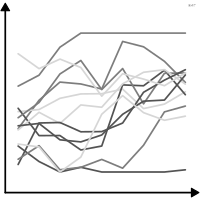
spaghetti chart
Unreadable overlay of too many lines.
critique
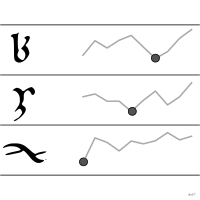
sparkline
Small axis-free chart embedded in running text.
chart, lines and areas
spatial region
Bounded area of the plane grouping the marks of one category.
encoding
spatial variable
Visual variable that places a mark along x, y or z.
encoding
spin-and-brush
Manual clustering that colors the groups spotted while projections rotate.
interaction
spine chart
Single value split into two opposed components either side of an axis.
chart, bars
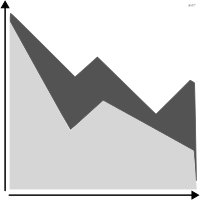
stacked area chart
Areas cumulated on top of one another.
chart, lines and areas
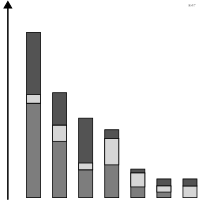
stacked bar chart
Bars split into segments that sum to the total.
chart, bars
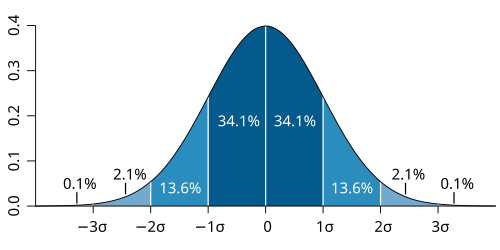
image: Wikimedia Commons, M. W. Toews, CC BY 2.5
standard deviation
Measure of spread around the mean.
statistics
standard error
Standard deviation of the sampling distribution of an estimate.
statistics
static visualization
Fixed representation that the reader cannot manipulate.
process
statistical graphics
The field concerned with the visual display of quantitative data.
process
statistical significance
Difference judged unlikely under chance alone.
statistics
statistical transformation
Computation applied to the data before drawing, such as a count or a smooth.
encoding
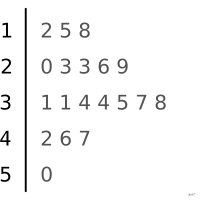
stem-and-leaf plot
Distribution where each value stays readable, the leading digit forming the stem and the next the leaf.
chart, text
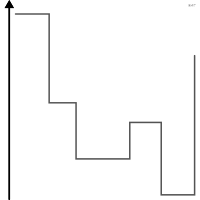
step chart
Line with plateaus marking discrete changes.
chart, lines and areas
stereographic projection
Conformal azimuthal projection that projects the globe from the point opposite the point of tangency.
map
Stevens' power law
Perceived magnitude follows a power function of physical magnitude.
perception
storyboard
Sequence of sketches setting the order and content of the steps of a story.
process
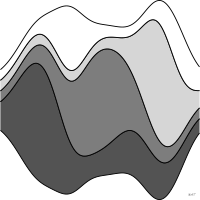
streamgraph
Stacked areas around a floating central baseline.
chart, lines and areas
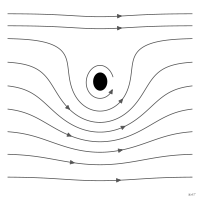
streamline plot
Curves tangent at every point to the direction of a vector field, such as a wind or a current.
chart, flows
stress
Measure of the disagreement between projected and observed distances.
statistics
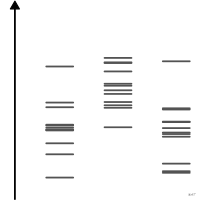
strip plot
Individual values projected onto a single axis.
chart, points and bubbles
stroke
Line delimiting a mark.
encoding
style guide
Document fixing colors, typefaces and graphical conventions.
process
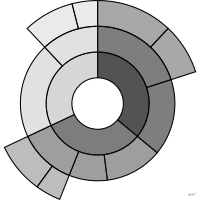
sunburst
Hierarchy shown as subdivided concentric rings.
chart, sectors, tilings and units
supplementary figure
Figure published as an appendix rather than in the body of the article.
process
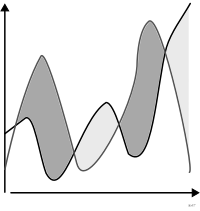
surplus-deficit filled line
Line whose area is filled either side of a baseline to contrast surplus and deficit.
chart, lines and areas
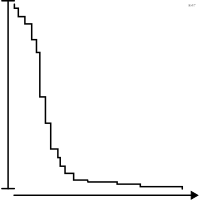
survival curve
Share of subjects still event-free over time.
chart, lines and areas
SVG
Vector format of the web where each mark stays an addressable object.
process
symbolization
Choice of the symbols and visual variables that stand for each datum on a map.
map
t-SNE
Nonlinear dimensionality reduction preserving local neighborhoods.
statistics
table sorting
Ordering rows by a meaningful column.
encoding
tabular figures
Digits of equal width intended for columns of numbers.
typography
tape diagram
Row of rectangles whose lengths stand for the quantities of an arithmetic word problem and their relations, used to find the unknown.
figure, non-chart figures
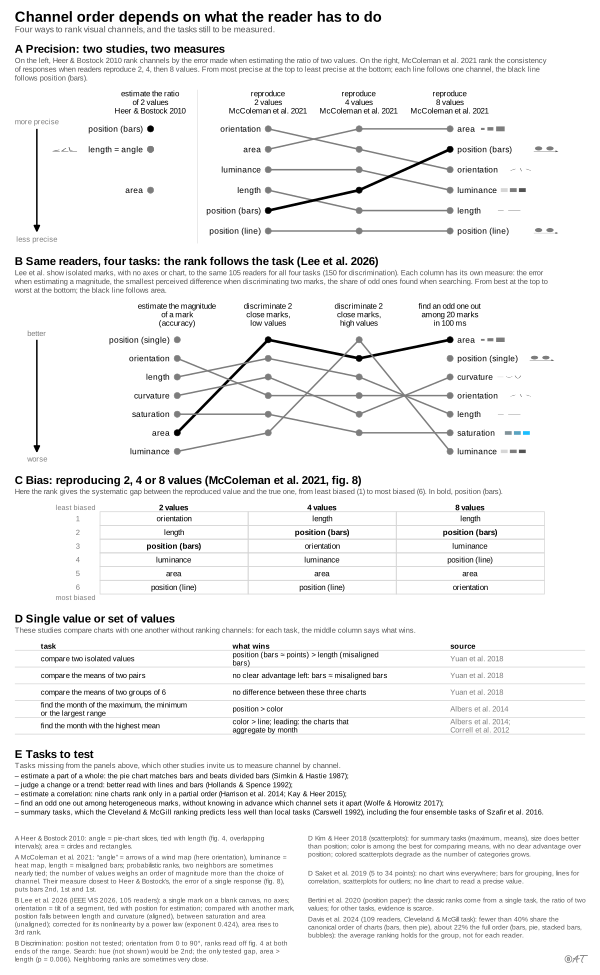
task typology
Classification of the tasks a reader or analyst performs with a visualization.
process
template
Reusable graphical structure for a series of figures.
process
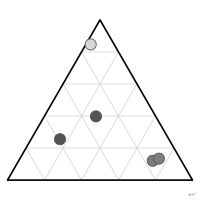
ternary plot
Scatterplot drawn in a triangle, where each point's position gives the shares of three components of a single whole.
chart, points and bubbles
text excerpt
Passage of text reproduced as a figure for its content or layout.
figure, non-chart figures
texture
Visual variable formed by the repeated elements filling a mark.
encoding
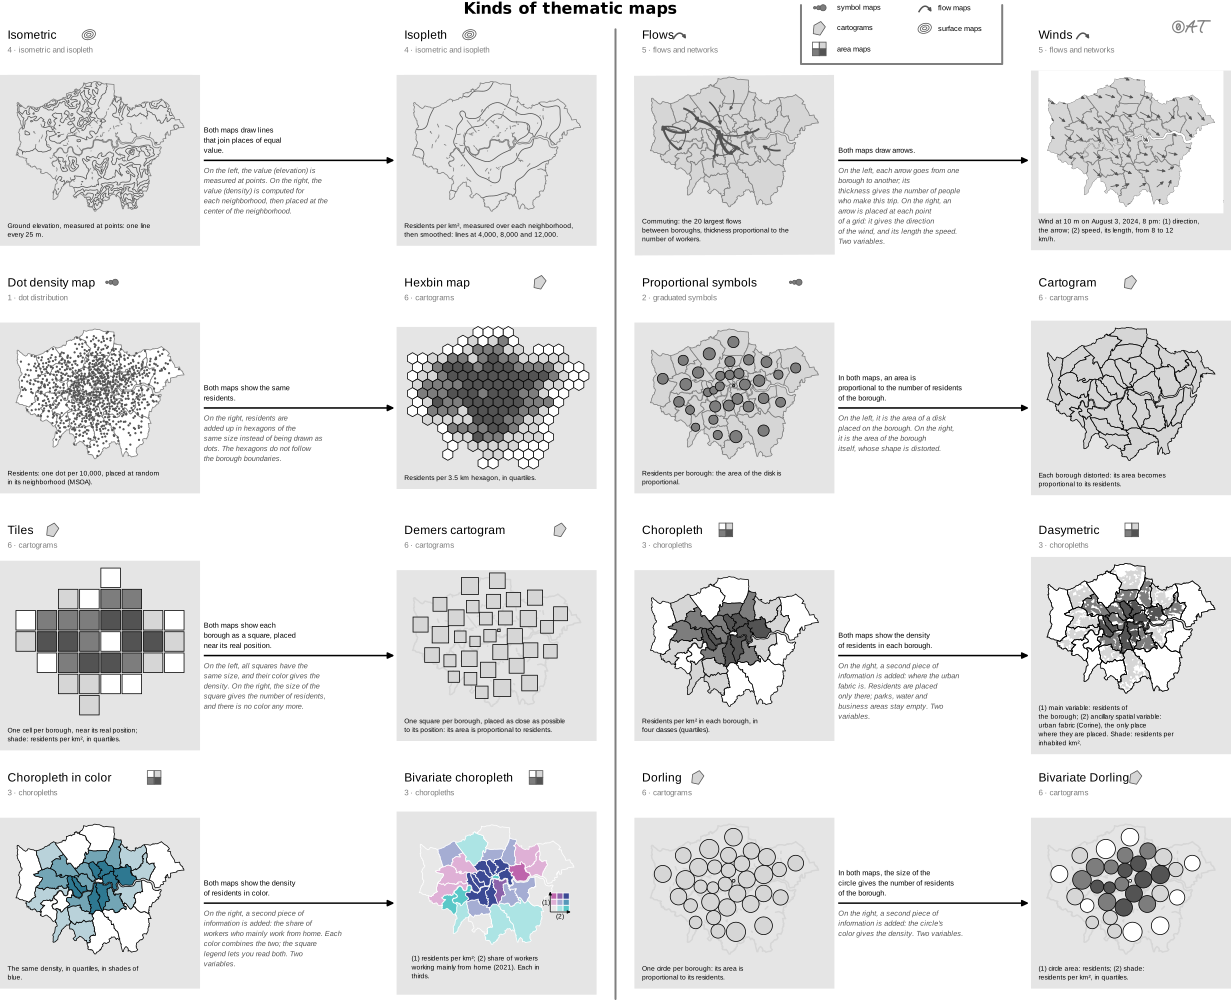
thematic map
Map devoted to showing a phenomenon rather than to locating.
map, maps
theme
All graphical settings independent of the data.
encoding
tick label
Value written next to a tick mark.
encoding
tick mark
Marker indicating a value on an axis.
encoding
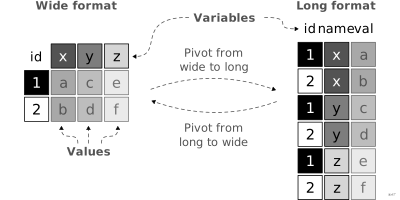
tidy data
Format where each variable is a column and each observation a row.
data
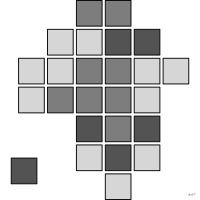
tile map
Schematic map where each unit occupies an equal-size cell.
map, maps
time series
Sequence of values indexed by time.
data
time-series decomposition
Splitting a time series into trend, seasonality and remainder.
statistics
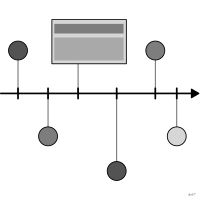
timeline
Events laid out along a time axis.
chart, timelines
tooltip
Panel shown on hover giving the detail of an element.
interaction
topographic map
Map depicting the relief and ground features of an area.
map
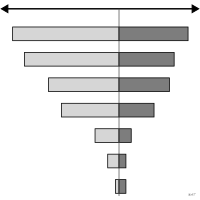
tornado chart
Opposed bars ranked by magnitude for a sensitivity analysis.
chart, bars
tour path
Ordered sequence of projections traversed by a tour.
interaction
tracking
Overall setting of space between characters.
typography
transition
Animated change preserving continuity between two states.
interaction
transverse Mercator projection
Mercator projection whose cylinder touches the globe along a meridian, conformal and little distorted near that meridian.
map
treemap
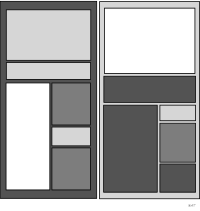
Hierarchy tiled with nested rectangles sized by value.
chart, sectors, tilings and units
trend line
Curve summarizing the general direction of a scatter.
statistics
trueness
Closeness of the mean of a large number of measurements to the true value.
statistics
truncated axis
Axis not starting at zero which exaggerates differences.
critique
tube map
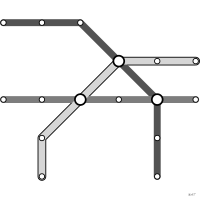
Topological schematic with strokes limited to a few angles.
chart, networks and trees
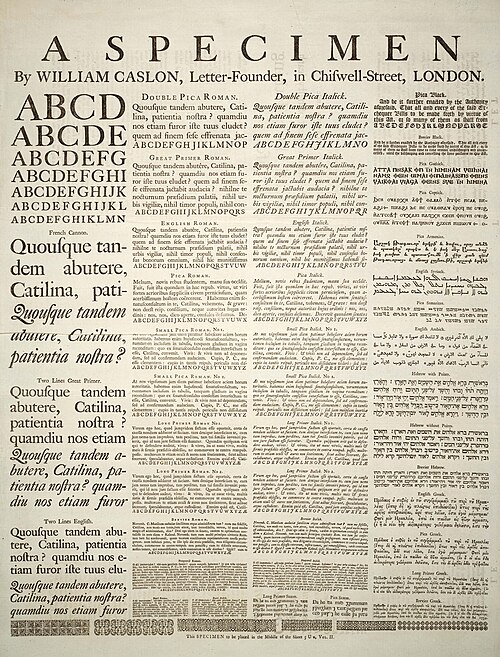
image: Wikimedia Commons, William Caslon, Public domain
typeface
Coherent set of letterform designs.
typography

image: Wikimedia Commons, Willi Heidelbach, CC BY 2.5
typography
Art of arranging type to make text legible and meaningful.
typography
UMAP
Nonlinear dimensionality reduction based on the neighborhood structure of the data.
statistics
uncertainty
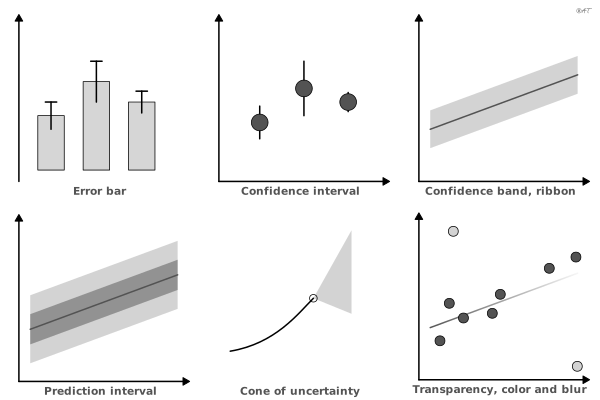
Range of values compatible with the observed data.
statistics
unclassed color scale
Scale varying color continuously with value.
color
unimodal distribution
Distribution with a single peak, or mode.
statistics
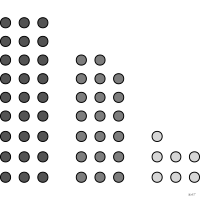
unit chart
One elementary shape per counted unit.
chart, sectors, tilings and units
univariate analysis
Study of one variable at a time: its distribution, central tendency and spread.
statistics
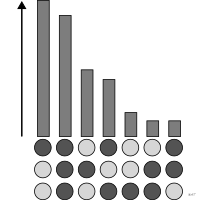
UpSet plot
Set intersections shown as bars rather than overlapping circles.
chart, sets
value
Position of a fill between light and dark.
encoding
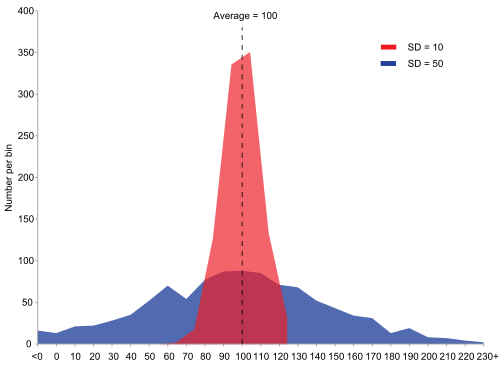
image: Wikimedia Commons, JRBrown, Public domain
variance
Square of the standard deviation measuring spread.
statistics
vector graphics
Image described by geometric shapes rather than pixels.
process
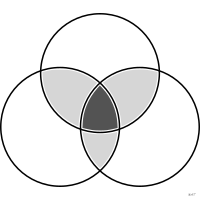
Venn diagram
Overlapping circles showing set intersections.
chart, sets
viewer
Person who receives the visualization and reads it.
process
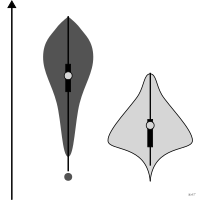
violin plot
Distribution density mirrored on both sides of an axis.
chart, boxes and densities
viridis
Perceptually uniform sequential palette safe for color blindness.
color
virtual reality
Simulated three-dimensional environment in which the user is immersed.
interaction
visual cortex
Brain region that processes the signals coming from the retina.
perception
visual cue
Graphical property the reader uses to interpret.
perception
visual encoding
Mapping of data onto graphical properties.
encoding
visual hierarchy
Reading order created by contrasts of size and weight.
typography
visual idiom
Particular combination of encoding and interaction forming a view type.
encoding
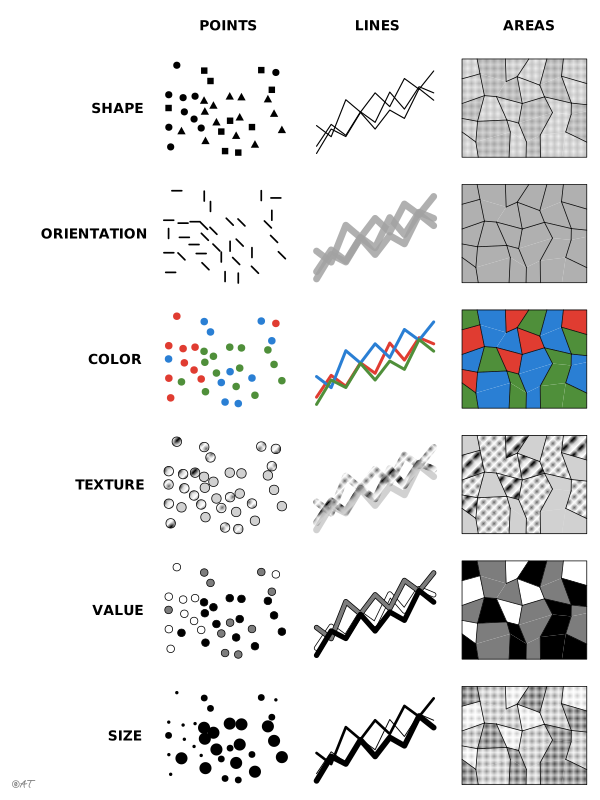
visual variable
Graphical property carrying information in Bertin's sense.
encoding
visual vocabulary
Catalog of chart types arranged by reading intent.
process
visual working memory
Limited capacity for temporarily holding visual elements.
perception
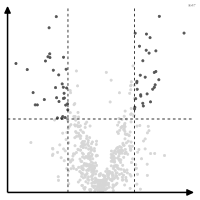
volcano plot
Effect size against significance in high-throughput analysis.
chart, points and bubbles

volume
Apparent volume of a mark encoding a quantity.
critique
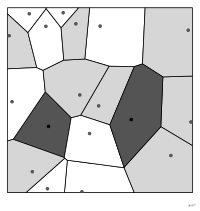
Voronoi diagram
Tiling of the plane into nearest-neighbor cells.
chart, sectors, tilings and units
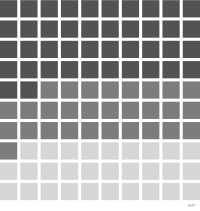
waffle chart
Grid of squares whose count encodes a proportion.
chart, sectors, tilings and units
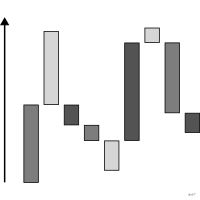
waterfall chart
Breakdown of a change into positive and negative contributions.
chart, bars
Waterman butterfly projection
Polyhedral projection unfolding the globe into a butterfly shape from a truncated octahedron.
map
web scraping
Automated retrieval of data published on the web.
process
Weber's law
The discrimination threshold grows in proportion to intensity.
perception
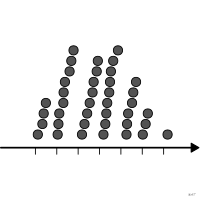
wheat plot
Dot plot binned like a histogram in which each dot stays at its exact value.
chart, points and bubbles
whisker
Segment extending the box out to the retained extreme values.
encoding
white space
Empty areas that structure the layout.
typography
wide format
Table where each measure has its own column.
data
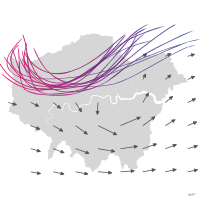
wind map
Map showing wind direction and strength through oriented or animated strokes.
map, maps

wind rose
Polar diagram of frequencies by direction.
chart, radial
wireframe
Structural sketch without final graphic content.
process
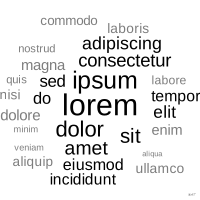
word cloud
Words whose size encodes frequency.
chart, text
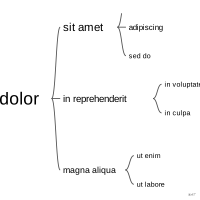
word tree
Branching of word sequences following a pivot term.
chart, networks and trees
x-axis
Horizontal axis of the coordinate system.
encoding
x-height
Height of lowercase letters without ascenders.
typography
y-axis
Vertical axis of the coordinate system.
encoding
zooming (interaction)
Changing the display scale over a region.
interaction
- 3D chart
Chart whose marks are rendered as volumes although the third dimension encodes no data.
chart, critique
- abstraction
Restating a concrete problem in terms of data and task types.
process
- accessibility
Design allowing use by people with varied abilities.
process
- accuracy
Closeness of a measurement to the true value.
statistics
- adjacency matrix
Square matrix encoding the presence of links between nodes.
chart, matrices and tables
- aesthetic
Mapping of a variable to a graphical attribute in the grammar of graphics.
encoding
- affective objective
Learning objective about an attitude or value of the viewer rather than about a fact.
process
- aggregation
Summarizing several observations into a single value.
data
- alignment
Matching of the edges of elements.
typography
- alluvial diagram
Blocks stacked at each stage of an ordered sequence, linked from one stage to the next by bands whose width encodes the count moving from one group to another.
chart, flows
- alluvial plot
Gapless stacked blocks at each stage of an ordered sequence, crossed by ribbons that each follow the same group of units from the first stage to the last; the height of a column gives the count at that stage.
chart, flows
- alpha
Degree of transparency of a mark.
encoding
- alt text
Textual description of a figure for screen readers.
process
- angle
Opening of a sector encoding a quantity.
encoding
- animated transition
Continuous movement of marks between two states to preserve tracking.
interaction
- animation
Time transition between successive states of a view.
interaction
- annotation
Text or stroke added to point out something notable.
encoding
- annotation layer
Set of explanatory elements layered over the representation.
encoding
- Anscombe's quartet
Four datasets with identical statistics but very different shapes.
statistics
- anti-objective
Conclusion the viewer should not draw from the visualization.
process
- APCA
Text-background contrast measure grounded in perception rather than a plain luminance ratio.
color
- apophenia
Perception of structure in purely random data.
critique
- arbitrary threshold
Cutoff picked without justification and used as the yardstick for a phenomenon.
critique
- arc diagram
Nodes on a line joined by arcs.
chart, networks and trees
- area
Area of a mark encoding a quantity.
encoding
- area as quantity
Value encoded by the radius of a shape rather than by its area.
critique
- area chart
Line chart with the area under the line filled in.
chart, lines and areas
- arrangement
Layout of the elements within a mark used as a visual variable.
encoding
- aspect ratio
Ratio of width to height of the plotting area.
encoding
- assistive technology
Hardware or software compensating for an impairment to access content.
process
- associativity
Property of a visual variable leaving categories equally visible.
perception
- atlas
Organized collection of maps covering a territory or a theme.
map
- attention
The gaze selecting one part of the scene at the expense of the rest.
perception
- audience
Intended group of recipients for the visualization.
process
- axis
Graduated line materializing a scale.
encoding
- axis label
Text naming the variable carried by an axis and its unit.
encoding
- banding
Spurious visible boundaries in a continuous gradient.
critique
- banking to 45 degrees
Choosing the aspect ratio so average slopes sit near 45 degrees.
encoding
- bar chart
Bars whose length encodes a quantity compared across categories.
chart, bars
- barcode plot
Every value drawn as a thin tick on a single axis.
chart, points and bubbles
- baseline
Reference value from which marks start.
encoding
- bean plot
Mirrored density in which each observation is a short line, and the group mean a longer one.
chart, boxes and densities
- beeswarm plot
Non-overlapping offset points revealing local density.
chart, points and bubbles
- big data
Data too large or too fast for conventional tools.
data
- bin
Interval of grouped values.
encoding
- binning
Splitting a continuous variable into intervals.
encoding
- bipartite network
Network whose nodes form two sets with every link joining one node from each set.
chart, networks and trees
- biplot
Simultaneous projection of individuals and variables of an ordination.
chart, points and bubbles
- bivariate map
Map that crosses two variables in a single color legend.
map, maps
- Bland-Altman plot
Difference between two measurements against their mean.
chart, points and bubbles
- block diagram
Diagram of a system in which each component is a box and each exchange a line or arrow between boxes, with no internal detail.
figure, non-chart figures
- bootstrap
Uncertainty estimated by repeated draws from the sample.
statistics
- box plot
Distribution summary using median, quartiles and extremes.
chart, boxes and densities
- branch support
Value borne by a branch measuring confidence in the grouping.
encoding
- brief
Document framing the request, objectives and constraints.
process
- brightness
Perceived light intensity of a source or surface.
perception
- brushing
Direct selection of a subset of marks.
interaction
- brushing and linking (interaction)
Propagation of a selection to all coordinated views.
interaction
- bubble chart
Scatterplot where size encodes a third variable.
chart, points and bubbles
- bullet graph
Single bar compared to a target and reference bands.
chart, bars
- bump chart
Change in rank of several entities over time.
chart, lines and areas
- calendar heatmap
Calendar grid where each day is colored by a value.
chart, matrices and tables
- calligram
Text laid out so as to draw a figure related to its meaning.
figure
- callout
Annotation linked to a precise point by a line.
encoding
- candlestick chart
Mark encoding open, close, low and high over a period.
chart, bars
- caption
Text under the figure identifying and explaining it.
process
- Cartesian coordinates
Frame with perpendicular axes.
encoding
- cartogram
Map whose areas are distorted in proportion to a variable.
map, maps
- cartographic generalization
Simplification of a map by selecting, smoothing, aggregating or displacing features to suit its scale and purpose.
map
- cartography
Art and technique of designing and reading maps.
map
- categorical data
Data whose values are unordered categories.
data
- category
“Identifiable part of a component or of a variable” (Bertin, translated).
data
- causal inference
Cause-and-effect link read into a chart without the data establishing it.
critique
- central tendency
Typical value around which data cluster, such as the mean, median or mode.
statistics
- change blindness
Failure to notice a visual change between two views.
perception
- channel
Graphical attribute of a mark that encodes a value.
encoding
- channel ranking
Ordering of visual channels by how accurately readers decode them for a given attribute type and task.
encoding
- chart
Visual representation of data through positioned marks and graphical attributes.
chart
- chart chooser
Decision tree leading from the need to the chart type.
process
- chart type
Established combination of marks, attributes and layout that goes by a name of its own.
encoding
- Chartability
Set of heuristics for auditing the accessibility of a data visualization.
process
- chartjunk
Graphical ornament that carries no information.
critique
- Chernoff faces
Multivariate display in which each variable drives one feature of a drawn human face.
chart, glyphs
- cherry-picking
Choosing the data or period that supports the desired conclusion.
critique
- chord diagram
Relationships between entities placed around a circle.
chart, flows
- choropleth map
Map whose areas are colored by a relative value.
map, maps
- CIELAB
Space approximately uniform for human perception.
color
- circle packing
Hierarchy shown as nested circles.
chart, sectors, tilings and units
- Circos plot
Relationships between genomic regions arranged around a circle.
chart, radial
- classed color scale
Scale assigning one flat color to each class of values.
color
- Cleveland dot plot
Dots positioned on a shared axis against categories.
chart, bars
- Cleveland-McGill hierarchy
Ranking of encodings by reading accuracy with position first.
perception
- closure
The eye completes incomplete shapes.
perception
- clustering
Grouping of observations into classes that are not set in advance.
statistics
- CMYK
Subtractive model used in printing.
color
- coefficient plot
Model coefficients and their intervals aligned on a common axis.
chart, points and bubbles
- cognitive load
Mental effort demanded by reading a representation.
perception
- color bar
Continuous legend showing the color-value mapping.
encoding
- color blindness
Reduced perception of certain hue differences.
color
- color model
System for describing colors such as RGB, HSL or CIELAB.
color
- color ramp
Continuous progression of colors mapped to values.
color
- color space
Geometric representation of the set of colors.
color
- color wheel
Circular arrangement of hues.
color
- color–emotion association
Consistent link between a color and an emotion within a given audience.
color
- ColorBrewer
Set of cartographic palettes tested for legibility.
color
- combination chart
Two mark types overlaid in the same coordinate system.
chart, composites
- common fate
Elements moving together are perceived as a group.
perception
- compact letter display
Letters shared by the groups a test cannot tell apart.
encoding
- complementary colors
Hues opposite on the color wheel.
color
- component
Variable of the information transcribed in the graphic.
encoding
- composite figure
Figure gathering several panels under one caption and one number.
process
- compromise projection
Projection that preserves neither angles nor areas but limits both distortions.
map
- cone of uncertainty
Cone-shaped area around the forecast track of a hurricane showing uncertainty about the position of its center.
encoding
- confection
Assembly of visual events drawn from various sources and juxtaposed to carry an argument.
chart, non-chart figures
- confidence band
Area framing a fitted curve and showing the uncertainty of the fit.
encoding
- confidence interval
Interval expected to contain the parameter at a given rate.
statistics
- confirmation bias
Tendency to retain only what confirms the expectation.
critique
- conformal projection
Projection preserving angles, and thus local shape, while distorting areas.
map
- confusion matrix
Table crossing the observed classes with the classes predicted by a model.
statistics
- connected scatterplot
Scatterplot whose points are joined in time order.
chart, points and bubbles
- consistency
Using the same encoding for the same quantity across a series of figures.
process
- continuity
The eye follows the smoothest paths.
perception
- continuous variable
Variable that can take any value in an interval.
data
- contour map
Lines joining points of equal value.
map, maps
- contrast
Perceptible difference between two neighboring areas.
color
- convex hull
Smallest convex polygon containing a set of points.
encoding
- coordinate system
Geometric frame that places the marks.
encoding
- coordinated multiple views
Several views of one dataset reacting together.
interaction
- correlation
Measure of the presence and the extent of a mutual relationship between two variables.
statistics
- correlation coefficient
Normalized measure of association between two variables.
statistics
- correlogram
Autocorrelation of a series plotted against the lag.
chart, lines and areas
- corrgram
Colored matrix of correlation coefficients between every pair of variables.
chart, matrices and tables
- count
Number of observations in a category.
data
- covariation
“The tendency for the values of two or more variables to vary together in a related way”
statistics
- crispness
Degree of blur of the edges and fill of a mark.
encoding
- cross-filtering
Filter applied in one view that restricts all the others.
interaction
- curvature
Degree of bending of a line mark encoding a magnitude.
encoding
- cycle plot
Time series split by phase of the cycle to separate trend from seasonality.
chart, lines and areas
- dashboard
Set of summary views monitored over time.
process
- dasymetric map
“A technique in which attribute data that is organized by a large or arbitrary area unit is more accurately distributed within that unit by the overlay of geographic boundaries that exclude, restrict, or confine the attribute in question.”
map, maps
- data art
Artwork using data as its material.
process
- data cleaning
Correction of errors, duplicates and inconsistencies.
process
- data density
Amount of information displayed per unit of area.
critique
- data journalism
Journalism grounded in the analysis and display of data.
process
- data physicalization
Physical artifact whose geometry or material encodes data.
encoding
- data provenance
Documented history of the transformations applied to the data.
data
- data science
Field combining statistics, computing and an application domain.
process
- data source
Declared origin of the data used.
data
- data storytelling
Building a narrative that guides the reader through the data.
process
- data table
Presentation of exact values in rows and columns.
chart, matrices and tables
- data validity issues
Data quality flaw ignored or wrongly invoked to support a conclusion.
critique
- data visualization
Graphical representation of data meant to reveal its structure.
process
- data wrangling
Shaping data before analysis or visualization.
process
- data-ink ratio
Share of ink devoted to information out of total ink.
critique
- dataset
Structured set of observations and variables.
data
- decision tree
Tree that chains choices and uncertain events, from the root to the leaves, up to the possible outcomes of each path.
chart, networks and trees
- decoding
Process by which a reader recovers a value from the chart.
encoding
- dendrogram
Tree showing a hierarchical classification.
chart, networks and trees
- density plot
Smoothed estimate of a continuous variable's distribution.
chart, lines and areas
- dependent variable
Variable whose values change according to the independent variable.
data
- depth
Position of a mark along the viewing axis of a three-dimensional scene.
encoding
- depth perception
Ability to judge the distance and relief of objects from visual cues.
perception
- descriptive statistics
Methods that summarize and describe data with summary measures, tables and graphs.
statistics
- design critique
Collective review of a figure before publication.
process
- details on demand (interaction)
Detail shown only when the reader asks for it.
interaction
- detrending
Removing the long-term trend of a time series to bring out its deviations.
statistics
- developable surface
Surface (plane, cylinder or cone) that unrolls flat without distortion and onto which the globe is projected.
map
- diagonalization
Reordering the rows and columns of a matrix until its structure appears.
process
- diagram
Construction in which “the correspondences in the plane can be established between all the elements of one component and all the elements of another component” (Bertin, translated).
chart
- dimension reduction
Projection of data with many correlated variables onto a few key dimensions.
statistics
- dimensionality
Number of variables describing each observation.
data
- direct labeling
Series name placed on the series itself rather than in a legend.
encoding
- discrete variable
Variable taking only countably many values.
data
- dissociative variable
Visual variable that changes the visibility of signs and prevents perceiving them all equally.
encoding
- distortion (interaction)
Enlarging part of the view at the expense of the rest which stays visible.
interaction
- distribution
Spread of counts over the possible values.
statistics
- diverging bar chart
Bars running up or down from a reference line according to sign.
chart, bars
- diverging palette
Two-branch palette around a pivot value.
color
- diverging stacked bar chart
Stacked bars whose segments extend either side of a baseline.
chart, bars
- donut chart
Pie chart with a hole in the middle.
chart, sectors, tilings and units
- Dorling cartogram
Cartogram where each unit becomes a proportional circle.
map, maps
- dose-response curve
Curve of the measured response as a function of the administered dose.
chart, lines and areas
- dot density map
Scattered dots whose count encodes a total.
map, maps
- dot plot
Distribution in which each observation is a dot stacked above its value.
chart, points and bubbles
- dots per inch
Unit of resolution in printing.
process
- drawing
Image drawn by hand or by computer without relying on data.
figure, non-chart figures
- drill-down
Moving from an aggregated level to a finer one.
interaction
- dual axis
Two different vertical scales in the same chart.
critique
- dual coding
Reinforcement of information through two distinct channels.
perception
- dumbbell chart
Two joined dots showing the gap between two states.
chart, points and bubbles
- ecological fallacy
Conclusion about individuals drawn from aggregated data.
critique
- effect size
Measure of an effect's magnitude independent of sample size.
statistics
- effectiveness principle
The most important attributes are encoded with the most salient channels.
encoding
- efficiency
Quality of a construction answering a question correctly in a shorter observation time than another.
critique
- eigenvalue
Amount of variance carried by an ordination axis.
statistics
- elementary reading
Question bearing on a single element: at this date what is the value?
perception
- empirical cumulative distribution function
Curve giving the share of observations below each value.
chart, lines and areas
- enclosure
A shared frame creates a group.
perception
- Equal Earth projection
Pseudocylindrical equal-area projection designed in 2018 after the look of the Robinson projection.
map
- equal interval classification
Classification into classes spanning equal ranges of values.
map
- equal-area projection
Projection preserving area ratios at the cost of shape.
map
- error bar
Segment showing the spread or uncertainty of an estimate.
statistics
- Euler diagram
Sets where only the actual intersections are drawn.
chart, sets
- explanatory visualization
Visualization made to convey an identified message.
process
- exploratory data analysis
Graphical examination of data without strong prior hypotheses.
process
- exploratory visualization
Visualization made to discover structure for oneself.
process
- expressiveness principle
Principle that “the visual encoding should express all of, and only, the information in the dataset attributes”.
encoding
- external identification
Reading step where the observer recognizes what the graphic is about.
perception
- extract (interaction)
Retrieval of a data subset together with its query parameters.
interaction
- extrapolation
Projection of the data beyond the known points.
statistics
- facet
Sub-chart obtained by splitting the data by a variable.
encoding
- faceting
Splitting a chart into small multiples by a variable.
encoding
- factor loading
Weight of a variable in the construction of an axis.
statistics
- failure to account for statistical nuance
Conclusion ignoring a statistical subtlety such as the lack of a control group.
critique
- fan chart
Forecast surrounded by widening uncertainty bands.
chart, lines and areas
- figuration
Construction that must be read shape by shape because it does not fit into a single image.
perception
- figure numbering
Figure referencing allowing them to be called out in the text.
process
- figure title
Text announcing what a figure is about.
process
- fill
Interior color of an area mark.
encoding
- filtering (interaction)
Reducing the display to the selected observations.
interaction
- flow chart
Diagram of the steps and decisions of a process.
chart, networks and trees
- flow map
Map showing directed movement between places.
map, maps
- focus indicator
Visual mark showing which element receives keyboard input.
interaction
- font
A typeface in a given size and style.
typography
- font weight
Stroke thickness of a typeface.
typography
- forest plot
Effects and confidence intervals of several studies aligned.
chart, points and bubbles
- frequency framing
Expressing a probability as a number of cases out of a total.
statistics
- frequency polygon
Distribution drawn as a line joining the tops of the bins.
chart, lines and areas
- funnel chart
Successive steps of a process with a shrinking population.
chart, bars
- funnel plot
Effect against precision used to detect publication bias.
chart, points and bubbles
- Gall-Peters projection
Cylindrical equal-area projection with standard parallels at 45 degrees.
map
- gamut
Set of colors a device can reproduce.
color
- Gantt chart
Horizontal bars placing tasks along a timeline.
chart, timelines
- gauge chart
Circular dial showing a single value.
critique
- geographic information system
System for managing and analyzing located data.
map
- geometric symbol
Graphic symbol made of a point, a line, an area, a surface or a volume.
encoding
- geometry
Type of mark used to represent the observations.
encoding
- geospatial data
Data tied to a position on the Earth.
data
- Gestalt principles
Rules describing how the eye groups visual elements.
perception
- gist
Mental overview of a scene maintained despite eye movements.
perception
- glyph
Small composite shape encoding several variables at once.
encoding
- Goode homolosine projection
Interrupted equal-area projection joining the sinusoidal at low latitudes and the Mollweide at high latitudes.
map
- grammar of graphics
Framework decomposing a chart into data, scales, geometries and layers.
encoding
- grand tour
Animation of a continuous sequence of low-dimensional projections of multivariate data.
interaction
- granularity
Size of the repeated elements of a texture at equal ink density.
encoding
- graph paper
Paper printed with a regular grid for plotting data by hand.
process
- graph theory
Branch of mathematics studying sets of vertices joined by edges.
statistics
- graphic density
Number of signs relative to the available area.
critique
- graphic design
Design of the visual form of a message.
process
- graphic processing
Reworking a graphic until it answers the question asked.
process
- graphicacy
Ability to read and produce graphical representations.
perception
- graphical abstract
Single figure summarizing the point of an article.
process
- graphical integrity
Faithfulness of the representation to the magnitude of the data it displays.
critique
- graphical perception
Study of how accurately graphical encodings are read.
perception
- graticule
Network of meridians and parallels drawn on a map.
map
- grayscale
Range of grays from black to white, without hue.
color
- gridline
Background line helping to read values.
encoding
- grouped bar chart
Bars juxtaposed within groups to compare several series.
chart, bars
- guided tour
Tour that steers the sequence of projections toward those showing a sought-after structure.
interaction
- headline
Title stating the conclusion to draw from the chart rather than its topic.
process
- heatmap
Matrix whose cells are colored by value.
chart, matrices and tables
- hexbin map
Spatial aggregation into hexagonal cells.
map, maps
- hexbin plot
Scatterplot whose plane is divided into hexagons shaded by the number of points.
chart, points and bubbles
- hierarchical clustering
Grouping of observations into nested classes summarized by a dendrogram.
statistics
- high-dimensional data
Data described by a large number of variables.
data
- highlighting
Visual strengthening of a subset against the rest.
interaction
- histogram
Distribution of a continuous variable split into bins.
chart, bars
- history (interaction)
Log of user actions that supports undo and replay.
interaction
- hive plot
Network whose nodes sit on radial axes according to their attributes.
chart, networks and trees
- hockey stick chart
Long flat curve that bends sharply upward at the end of the series.
chart, lines and areas
- horizon chart
Time series folded into colored bands to save vertical space.
chart, lines and areas
- HSL
Model describing color by hue, saturation and lightness.
color
- hue
Chromatic component perceived as red, blue, green and so on.
color
- hyperbolic tree
Node-link tree drawn in hyperbolic geometry that enlarges the focus and squeezes the rest toward the edge of a disk.
chart, networks and trees
- hypothetical outcome plot
Animation cycling through equally likely draws to show uncertainty.
statistics
- icon
Small figurative image standing for a category or action.
encoding
- iconic memory
Very brief visual memory, lasting a few hundred milliseconds, that holds an image just after it is seen.
perception
- identity channel
Channel telling what something is or where it is suited to categorical attributes.
encoding
- image
“Meaningful visual form perceived in an instant of perception (in a single glance)” (Bertin, translated).
perception
- implantation
Geometric nature of the sign in Bertin: point, line or area.
encoding
- imposition
Bertin's use of the plane: diagram, network, map or symbol.
encoding
- incorrect reading of chart
Misreading induced by a flaw in the design of the chart.
critique
- independent variable
Variable that is varied and does not depend on the other data in the chart.
data
- index number
Series rescaled to 100 at a reference date.
data
- induction
The reader's ability to draw far more from a graphic than the information deliberately put into it.
perception
- infographic
Graphic composition combining data, text and illustration.
process
- information design
Design of artifacts that make information understandable.
process
- information visualization
Visual representation of abstract non-spatial data.
process
- inset
Small chart inserted inside a larger one.
encoding
- insight need
Question a visualization must help answer.
process
- interaction plot
Effect of one factor drawn separately for each level of another.
chart, lines and areas
- interactivity
Ability for the reader to act on the representation.
interaction
- internal identification
“Stage of the reading process during which the observer recognizes on the drawing the visual variables assigned to the components of the information” (Bertin, translated).
perception
- interpolation
Estimating a value that falls between two known points.
statistics
- interquartile range
Difference between the third and first quartiles, spanning the middle half of the values.
statistics
- interval scale
Measurement with constant spacing but no absolute zero.
data
- invariant
Notion common to all the data of a graphic and stated in the title.
encoding
- inventory
Graphic representation recording the information exhaustively.
process
- inverted axis
Axis running in reverse so that a rise reads as a fall.
critique
- Ishikawa diagram
Fish-skeleton diagram that sorts the possible causes of an effect into categories, drawn as slanted bones along a central spine leading to the effect.
chart, networks and trees
- ISOTYPE
Neurath's standardized pictogram system for statistics.
encoding
- iteration
Successive rework of a figure from feedback.
process
- jitter
Small random displacement of points to avoid overlap.
encoding
- just-noticeable difference
Smallest detectable difference between two stimuli.
perception
- k-means
Partitioning into k classes that minimizes the distance of each observation to its class center.
statistics
- kagi chart
Price chart without a time scale, drawn as a vertical line that turns back only when the price retraces by more than a preset amount.
chart, lines and areas
- kerning
Adjustment of space between two adjacent characters.
typography
- keyboard navigation
Browsing and operating a visualization with the keyboard alone.
interaction
- kurtosis
Weight of a distribution's extreme values.
statistics
- label
Text identifying an element of the chart.
encoding
- Lambert conformal conic projection
Conformal conic projection, common for mid-latitude regions that extend east to west.
map
- layer
Set of marks stacked on the previous ones in a chart.
encoding
- layout grid
Invisible framework aligning the elements of a layout.
typography
- leader line
Thin line joining a label to the element it names.
encoding
- leading
Vertical space between successive baselines.
typography
- learning objective
Statement of what the viewer should be able to do or feel after reading the visualization.
process
- legend
Lookup table between graphical codes and categories.
encoding
- legend toggle
Clickable legend hiding or revealing series.
interaction
- legibility
Ability of a construction to let its signs be separated.
critique
- length
Linear extent of a mark encoding a quantity.
encoding
- length of a component
Number of distinct categories a component holds.
encoding
- level of organization
Perceptual property of a visual variable: selective, ordered or quantitative.
encoding
- level of reading
“Number of correspondences involved in an instant of perception” (Bertin, translated).
perception
- lie factor
Ratio of the visual effect shown to the effect in the data.
critique
- lightness
Position of a color between black and white.
color
- Likert chart
Ordered responses split either side of a neutral point.
chart, bars
- line chart
Points joined by a line to show an ordered progression.
chart, lines and areas
- line type
Line pattern such as solid, dashed or dotted.
encoding
- linear discriminant analysis
Method that seeks the linear combinations of variables that best separate known groups.
statistics
- linear regression
Fitting a line minimizing squared deviations.
statistics
- linguistic symbol
Graphic symbol made of text, numerals or punctuation marks.
encoding
- local tour
Tour that explores the projections close to a starting projection.
interaction
- locator map
Simple map showing where the place discussed in the text lies.
map, maps
- LOESS
Smoothing by successive local regressions.
statistics
- logarithmic scale
Scale where a constant distance means a constant ratio.
encoding
- lollipop chart
Thin stem topped by a dot replacing the bar.
chart, bars
- long format
Table where measured variables are stacked into one column.
data
- long-term memory
Durable store of knowledge that gives meaning to what is perceived.
perception
- Lorenz curve
Curve giving, for each cumulative share of the population, the cumulative share of a quantity it holds, such as income.
chart, lines and areas
- lossless compression
Image compression restoring the original pixel for pixel.
process
- lossy compression
Image compression degrading the original to reduce file size.
process
- luminance
Perceived amount of emitted light independent of hue.
color
- magnitude channel
Channel perceived as ordered, suited to ordinal and quantitative attributes.
encoding
- Manhattan plot
Significance of thousands of tests laid out along a genomic position.
chart, points and bubbles
- map
Construction in which “the correspondences in the plane are established between the elements of a geographic component arranged in the observed geographic order” (Bertin, translated).
map, maps
- map projection
Transformation of the globe onto a flat surface.
map
- margin
Space reserved around the plotting area.
encoding
- margin of error
Half-width of an estimate's confidence interval.
statistics
- marginal plot
Small plot along the margin of a main plot showing the distribution of one of its variables.
encoding
- Marimekko chart
Rectangles whose width and height encode two proportions.
chart, sectors, tilings and units
- mark
Basic geometric element of a chart.
encoding
- mean
Sum of values divided by their count.
statistics
- measure
Width of a column of text.
typography
- median
Value splitting the series into two equal halves.
statistics
- memorability
Ease with which a figure stays in memory after being seen.
perception
- Mercator projection
Conformal projection that greatly inflates high latitudes.
map
- message
“Memorable graphic representation” (Bertin, translated).
process
- metadata
Data describing the data itself.
data
- misleading chart
Chart whose form leads to a false reading of the data.
critique
- misrepresentation of scientific studies
Study invoked for a conclusion it does not support.
critique
- missing data
Absent values that must be shown rather than hidden.
data
- mockup
Faithful representation of the final rendering before build.
process
- mode
Most frequent value.
statistics
- model in the data space
Approach that shows a fitted model in the data space itself rather than through its summaries alone.
process
- modifiable areal unit problem
Dependence of results on the chosen spatial partition.
critique
- moiré effect
Spurious vibration produced by over-regular patterns.
critique
- Mollweide projection
Elliptical equal-area projection common for thematic world maps.
map
- monosemic graphic
Transcription of relationships between previously defined concepts.
encoding
- monospaced typeface
Typeface where all characters share the same width.
typography
- motion
Movement of a mark over time used as a visual variable.
encoding
- motion parallax
Depth cue in which, as the viewer moves, near objects seem to move faster than far ones.
perception
- moving average
Average computed over a sliding window.
statistics
- multifunctioning graphical element
Element that fills several roles at once instead of just one.
encoding
- natural breaks
Classification placing breaks so as to minimize variance within classes.
map
- network
Construction in which “the correspondences in the plane can be established between all the elements of one and the same component” (Bertin, translated).
chart
- network diagram
Nodes joined by links representing relationships.
chart, networks and trees
- nominal scale
Measurement by plain unordered categories.
data
- non-metric multidimensional scaling
Ordination preserving only the rank order of distances between objects.
statistics
- nonlinear dimension reduction
Dimension reduction that can unfold a curved structure instead of projecting it.
statistics
- normal distribution
Symmetric bell-shaped distribution.
statistics
- normalization
Bringing values to a common base to make them comparable.
data
- notched box plot
Box hollowed by a notch showing the uncertainty around the median.
chart, boxes and densities
- ogive
Polygon joining the cumulative frequencies at the upper class limits.
chart, lines and areas
- OKLCH
Perceptually uniform color space described by lightness, chroma and hue.
color
- onion diagram
Set diagram of concentric circles in which each set lies strictly inside the one around it, from the most general to the most specific.
chart, sets
- ordered variable
Visual variable whose categories order themselves spontaneously.
encoding
- ordinal data
Categories with an order but no measurable spacing.
data
- ordinal scale
Measurement by ordered categories without measurable spacing.
data
- ordination
Projection of objects described by many variables into a low-dimensional space.
chart, points and bubbles
- organizational chart
Tree of reporting lines within an organization.
chart, networks and trees
- orientation
Tilt of a mark distinguishing categories.
encoding
- original correspondence
“Meeting point of the elements of several components” (Bertin, translated).
encoding
- orthographic projection
Projection showing the globe as seen from an infinitely distant point.
map
- outlier
Observation far removed from the rest of the distribution.
statistics
- overall reading
Question reducing the whole information to a single answer: what was the general trend?
perception
- overplotting
Marks hiding one another in dense regions.
critique
- overview first zoom and filter details on demand
Recommended design sequence for interactive exploration.
interaction
- p-value
Probability of a result at least as extreme under the null hypothesis.
statistics
- panel
Plotting area of a sub-chart.
encoding
- panel label
Letter identifying one panel within a composite figure.
encoding
- panning
Moving the viewport without changing scale.
interaction
- pansemic graphic
The system opens onto any meaning.
encoding
- parallel coordinates
Parallel axes crossed by one polyline per observation.
chart, lines and areas
- parallel sets
Flows between the categories of several categorical variables.
chart, flows
- parallelism
Placing comparable elements side by side so the comparison makes itself.
encoding
- pattern
Motif whose repetition makes up a texture.
encoding
- pattern recognition
Detection of regularities in an image.
perception
- per capita
Related to the number of inhabitants.
data
- percentage point
Unit of difference between two percentages.
data
- percentile
Value below which a given percentage of observations fall.
statistics
- perceptible step
Step of a visual variable that the eye can tell apart from its neighbor.
encoding
- perceptually uniform
Palette where equal numeric steps look equally different.
color
- peripheral vision
Vision outside the center of gaze that detects motion and contrast, but little detail.
perception
- perspective projection
Projection of a three-dimensional scene onto a plane in which distant objects appear smaller.
map
- photograph
Image produced by a photographic process and reproduced as is.
figure, non-chart figures
- phylogenetic tree
Tree showing the kinship relationships between taxa.
chart, networks and trees
- pictogram
Repeated or stylized icon encoding a quantity or category.
chart, sectors, tilings and units
- pictorial symbol
Graphic symbol made of an image, an icon or a statistical glyph.
encoding
- pie chart
Disc split into sectors proportional to parts of a whole.
chart, sectors, tilings and units
- piling
Concentration of points at the center of a low-dimensional projection of high-dimensional data.
critique
- polar area chart
Equal-angle sectors whose radius encodes the value.
chart, radial
- polar coordinates
Frame where position is given by an angle and a radius.
encoding
- polysemic graphic
The system aims to define a concept or an idea but interpretations may diverge.
encoding
- pop-out
Immediate standing out of a unique element in a set.
perception
- population pyramid
Back-to-back bars comparing two groups by age class.
chart, bars
- position
Location of a mark on a common scale.
encoding
- position adjustment
Rule shifting overlapping marks to keep them readable.
encoding
- position on unaligned scale
Location of a mark on a scale offset from those of the marks it is compared with.
encoding
- preattentive processing
Immediate detection of some visual properties before focused attention.
perception
- precision
Reproducibility of a measurement regardless of its correctness.
statistics
- prediction interval
Interval expected to contain a future observation.
statistics
- principal component analysis
Ordination seeking the axes that carry the most variance.
statistics
- principle of proportional ink
The inked area representing a value must be proportional to that value.
critique
- print output
Fixed medium imposing constrained resolution and color gamut.
process
- progressive data analysis
Data analysis that delivers partial results of increasing quality while the computation runs.
process
- projection (interaction)
Interactive change of the projection of multidimensional data onto the plane.
interaction
- projection distortion
Alteration of angles, areas, distances or shapes that any projection of the globe onto a plane imposes.
map
- projection pursuit
Search for low-dimensional projections that optimize an index of structure.
statistics
- proportion
Fraction of a total.
data
- proportional symbol map
Symbols sized by an absolute quantity at a location.
map, maps
- proximity
Nearby elements are perceived as a group.
perception
- psychophysics
Study of the link between physical and perceived magnitude.
perception
- qualitative palette
Distinct unordered colors for categories.
color
- quantile classification
Classification putting the same number of observations in each class.
map
- quantile dot plot
Probability distribution cut into a fixed number of quantiles each drawn as a dot.
chart, points and bubbles
- quantile-quantile plot
Comparison of observed quantiles to a theoretical distribution.
chart, points and bubbles
- quantitative data
Measured data on which arithmetic is meaningful.
data
- quantitative variable
Visual variable allowing a numeric ratio to be read between two marks.
encoding
- quartile
Value splitting the distribution into four equal parts.
statistics
- radar chart
Axes radiating from a center joined into a polygon.
chart, radial
- radial bar chart
Bars laid out along a circular axis.
chart, radial
- radial tour
Tour that varies the share of a single variable in the projection to judge its importance.
interaction
- rainbow color map
Palette running through the whole spectrum to encode a quantity.
critique
- raincloud plot
Combination of a density, a box and the raw points.
chart, boxes and densities
- range bar chart
Bars that run, for each category, from a low value to a high value rather than from zero.
chart, bars
- range of a quantitative series
“Ratio between the largest and the smallest number of the series” (Bertin, translated).
encoding
- rarefaction curve
Expected richness as a function of sampling effort.
chart, lines and areas
- raster graphics
Image described by a grid of pixels.
process
- rate
Count related to a reference population.
data
- ratio scale
Measurement with an absolute zero allowing ratios.
data
- raw data
Data as collected before any processing.
data
- reasoning error
Logical flaw in the conclusion drawn from a chart, even a faithfully plotted one.
critique
- reference line
Line marking a notable value such as a threshold or a mean.
encoding
- reflow
Rearranging enlarged content so it stays readable without scrolling in two directions.
interaction
- regression
Model estimating one variable from one or more others.
statistics
- relational analysis
Analysis of the links between entities.
statistics
- reproducibility
Ability to rebuild the figure from the data and the code.
process
- residual plot
Model residuals plotted against fitted values.
chart, points and bubbles
- resolution
Pixel density of a raster image.
process
- responsive design
Adapting the layout to the screen size.
process
- retina
Light-sensitive layer of the eye that converts light into nerve signals.
perception
- retinal variable
Visual variable carried by the mark itself rather than by its location.
encoding
- RGB
Additive model used by screens.
color
- ribbon
Area delimiting the uncertainty around a line.
encoding
- ridgeline plot
Vertically offset densities used to compare distributions.
chart, boxes and densities
- Robinson projection
Compromise projection preserving neither angles nor areas but limiting both distortions.
map
- ROC curve
Sensitivity against false positive rate of a classifier.
chart, lines and areas
- rug plot
Short ticks along the margin of a chart marking the observed values.
encoding
- sage tour
Tour that spreads projected points radially to correct their piling at the center.
interaction
- saliency
Ability of an element to attract the eye.
perception
- sample size
Number of observations an estimate rests on.
statistics
- sampling
Selection of a representative subset of a population.
statistics
- Sankey diagram
Flows whose width encodes a quantity conserved between stages.
chart, flows
- sans serif
Letterforms without serifs.
typography
- saturation
Intensity or purity of a color.
color
- scagnostics
Numerical indices describing the shape of a scatterplot.
statistics
- scale
Rule mapping data values to positions or colors.
encoding
- scale bar
Segment of known length placed on the image to give its scale.
encoding
- scale break
Break in the axis to absorb an extreme value.
critique
- scatterplot
Points positioned by two quantitative variables.
chart, points and bubbles
- scatterplot matrix
Grid of all pairwise scatterplots.
chart, points and bubbles
- schematic
Simplified depiction of an object or process that encodes no data.
figure, non-chart figures
- scientific visualization
Visual representation of data with a physical spatial support.
process
- scree plot
Decreasing eigenvalues used to pick the number of axes.
chart, lines and areas
- screen reader
Software rendering the content of a screen as speech or braille.
process
- scrollytelling
Narrative whose steps trigger as the page scrolls.
interaction
- search and locate (interaction)
Finding an item and highlighting its place in the view.
interaction
- seizure risk
Hazard of a flash or red animation triggering an epileptic seizure.
critique
- selectivity
Property of a visual variable that isolates a category at a glance.
perception
- self-organizing map
Neural network that places observations on a grid while preserving their neighborhoods.
statistics
- semiology of graphics
Bertin's theory of how graphical signs work.
encoding
- sequential palette
Ordered light-to-dark palette for a quantitative variable.
color
- series
Sequence of related values within a table.
data
- serif
Small terminal stroke on letterforms.
typography
- shading
Continuous modulation of fill to suggest relief or intensity.
encoding
- shape
Outline of a mark distinguishing categories.
encoding
- shapefile
Geographic vector file format.
data
- signal-to-noise ratio
Share of useful information against distracting elements.
critique
- significance asterisks
Asterisks marking the significance threshold a comparison reaches.
encoding
- similarity
Similar elements are perceived as a group.
perception
- simplification
Cutting the number of elements until the question asked finds its answer.
process
- Simpson's paradox
Reversal of a trend depending on whether groups are aggregated.
critique
- simultaneous contrast
Shift in perceived color caused by its surroundings.
perception
- sina plot
Points of a distribution spread sideways in proportion to local density.
chart, points and bubbles
- situational impairment
Temporary limitation caused by the context of use rather than by the person.
process
- size
Dimension of a mark encoding a quantity.
encoding
- sketch
Quick sketch exploring representation options.
process
- skewed distribution
Distribution with one tail stretching much further than the other.
statistics
- skewness
Imbalance of a distribution around its center.
statistics
- slice tour
Tour that shows only the points near the projection plane to reveal the inside of shapes.
interaction
- slopegraph
Two axes joined by segments showing change between two points.
chart, lines and areas
- small caps
Capitals at lowercase height.
typography
- small multiples
Series of identical charts repeated across categories.
chart, composites
- smoothing
Damping of short-term variation to reveal the trend.
statistics
- sonification
Rendering of data as sound rather than as images.
encoding
- sorting
Ordering categories by value rather than alphabetically.
encoding
- spaghetti chart
Unreadable overlay of too many lines.
critique
- sparkline
Small axis-free chart embedded in running text.
chart, lines and areas
- spatial region
Bounded area of the plane grouping the marks of one category.
encoding
- spatial variable
Visual variable that places a mark along x, y or z.
encoding
- spin-and-brush
Manual clustering that colors the groups spotted while projections rotate.
interaction
- spine chart
Single value split into two opposed components either side of an axis.
chart, bars
- stacked area chart
Areas cumulated on top of one another.
chart, lines and areas
- stacked bar chart
Bars split into segments that sum to the total.
chart, bars
- standard deviation
Measure of spread around the mean.
statistics
- standard error
Standard deviation of the sampling distribution of an estimate.
statistics
- static visualization
Fixed representation that the reader cannot manipulate.
process
- statistical graphics
The field concerned with the visual display of quantitative data.
process
- statistical significance
Difference judged unlikely under chance alone.
statistics
- statistical transformation
Computation applied to the data before drawing, such as a count or a smooth.
encoding
- stem-and-leaf plot
Distribution where each value stays readable, the leading digit forming the stem and the next the leaf.
chart, text
- step chart
Line with plateaus marking discrete changes.
chart, lines and areas
- stereographic projection
Conformal azimuthal projection that projects the globe from the point opposite the point of tangency.
map
- Stevens' power law
Perceived magnitude follows a power function of physical magnitude.
perception
- storyboard
Sequence of sketches setting the order and content of the steps of a story.
process
- streamgraph
Stacked areas around a floating central baseline.
chart, lines and areas
- streamline plot
Curves tangent at every point to the direction of a vector field, such as a wind or a current.
chart, flows
- stress
Measure of the disagreement between projected and observed distances.
statistics
- strip plot
Individual values projected onto a single axis.
chart, points and bubbles
- stroke
Line delimiting a mark.
encoding
- style guide
Document fixing colors, typefaces and graphical conventions.
process
- sunburst
Hierarchy shown as subdivided concentric rings.
chart, sectors, tilings and units
- supplementary figure
Figure published as an appendix rather than in the body of the article.
process
- surplus-deficit filled line
Line whose area is filled either side of a baseline to contrast surplus and deficit.
chart, lines and areas
- survival curve
Share of subjects still event-free over time.
chart, lines and areas
- SVG
Vector format of the web where each mark stays an addressable object.
process
- symbolization
Choice of the symbols and visual variables that stand for each datum on a map.
map
- t-SNE
Nonlinear dimensionality reduction preserving local neighborhoods.
statistics
- table sorting
Ordering rows by a meaningful column.
encoding
- tabular figures
Digits of equal width intended for columns of numbers.
typography
- tape diagram
Row of rectangles whose lengths stand for the quantities of an arithmetic word problem and their relations, used to find the unknown.
figure, non-chart figures
- task typology
Classification of the tasks a reader or analyst performs with a visualization.
process
- template
Reusable graphical structure for a series of figures.
process
- ternary plot
Scatterplot drawn in a triangle, where each point's position gives the shares of three components of a single whole.
chart, points and bubbles
- text excerpt
Passage of text reproduced as a figure for its content or layout.
figure, non-chart figures
- texture
Visual variable formed by the repeated elements filling a mark.
encoding
- thematic map
Map devoted to showing a phenomenon rather than to locating.
map, maps
- theme
All graphical settings independent of the data.
encoding
- tick label
Value written next to a tick mark.
encoding
- tick mark
Marker indicating a value on an axis.
encoding
- tidy data
Format where each variable is a column and each observation a row.
data
- tile map
Schematic map where each unit occupies an equal-size cell.
map, maps
- time series
Sequence of values indexed by time.
data
- time-series decomposition
Splitting a time series into trend, seasonality and remainder.
statistics
- timeline
Events laid out along a time axis.
chart, timelines
- tooltip
Panel shown on hover giving the detail of an element.
interaction
- topographic map
Map depicting the relief and ground features of an area.
map
- tornado chart
Opposed bars ranked by magnitude for a sensitivity analysis.
chart, bars
- tour path
Ordered sequence of projections traversed by a tour.
interaction
- tracking
Overall setting of space between characters.
typography
- transition
Animated change preserving continuity between two states.
interaction
- transverse Mercator projection
Mercator projection whose cylinder touches the globe along a meridian, conformal and little distorted near that meridian.
map
- treemap
Hierarchy tiled with nested rectangles sized by value.
chart, sectors, tilings and units
- trend line
Curve summarizing the general direction of a scatter.
statistics
- trueness
Closeness of the mean of a large number of measurements to the true value.
statistics
- truncated axis
Axis not starting at zero which exaggerates differences.
critique
- tube map
Topological schematic with strokes limited to a few angles.
chart, networks and trees
- typeface
Coherent set of letterform designs.
typography
- typography
Art of arranging type to make text legible and meaningful.
typography
- UMAP
Nonlinear dimensionality reduction based on the neighborhood structure of the data.
statistics
- uncertainty
Range of values compatible with the observed data.
statistics
- unclassed color scale
Scale varying color continuously with value.
color
- unimodal distribution
Distribution with a single peak, or mode.
statistics
- unit chart
One elementary shape per counted unit.
chart, sectors, tilings and units
- univariate analysis
Study of one variable at a time: its distribution, central tendency and spread.
statistics
- UpSet plot
Set intersections shown as bars rather than overlapping circles.
chart, sets
- value
Position of a fill between light and dark.
encoding
- variance
Square of the standard deviation measuring spread.
statistics
- vector graphics
Image described by geometric shapes rather than pixels.
process
- Venn diagram
Overlapping circles showing set intersections.
chart, sets
- viewer
Person who receives the visualization and reads it.
process
- violin plot
Distribution density mirrored on both sides of an axis.
chart, boxes and densities
- viridis
Perceptually uniform sequential palette safe for color blindness.
color
- virtual reality
Simulated three-dimensional environment in which the user is immersed.
interaction
- visual cortex
Brain region that processes the signals coming from the retina.
perception
- visual cue
Graphical property the reader uses to interpret.
perception
- visual encoding
Mapping of data onto graphical properties.
encoding
- visual hierarchy
Reading order created by contrasts of size and weight.
typography
- visual idiom
Particular combination of encoding and interaction forming a view type.
encoding
- visual variable
Graphical property carrying information in Bertin's sense.
encoding
- visual vocabulary
Catalog of chart types arranged by reading intent.
process
- visual working memory
Limited capacity for temporarily holding visual elements.
perception
- volcano plot
Effect size against significance in high-throughput analysis.
chart, points and bubbles
- volume
Apparent volume of a mark encoding a quantity.
critique
- Voronoi diagram
Tiling of the plane into nearest-neighbor cells.
chart, sectors, tilings and units
- waffle chart
Grid of squares whose count encodes a proportion.
chart, sectors, tilings and units
- waterfall chart
Breakdown of a change into positive and negative contributions.
chart, bars
- Waterman butterfly projection
Polyhedral projection unfolding the globe into a butterfly shape from a truncated octahedron.
map
- web scraping
Automated retrieval of data published on the web.
process
- Weber's law
The discrimination threshold grows in proportion to intensity.
perception
- wheat plot
Dot plot binned like a histogram in which each dot stays at its exact value.
chart, points and bubbles
- whisker
Segment extending the box out to the retained extreme values.
encoding
- white space
Empty areas that structure the layout.
typography
- wide format
Table where each measure has its own column.
data
- wind map
Map showing wind direction and strength through oriented or animated strokes.
map, maps
- wind rose
Polar diagram of frequencies by direction.
chart, radial
- wireframe
Structural sketch without final graphic content.
process
- word cloud
Words whose size encodes frequency.
chart, text
- word tree
Branching of word sequences following a pivot term.
chart, networks and trees
- x-axis
Horizontal axis of the coordinate system.
encoding
- x-height
Height of lowercase letters without ascenders.
typography
- y-axis
Vertical axis of the coordinate system.
encoding
- zooming (interaction)
Changing the display scale over a region.
interaction
No term matches these filters.