
 chart
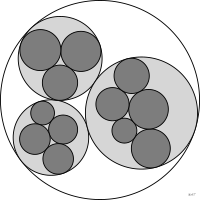
circle packing
also: packed circles, circular treemapHierarchy shown as nested circles.
Classification
- chart
- sectors, tilings and units › tilings
- part-to-whole
- the name evokes: nature
Channels
 area; main: value
 color luminance; secondary: depth
 color saturation; secondary: depth (instead of luminance)
 spatial region; main: hierarchy (nesting)
Scientific literature
OpenAlex: 225 papers since 1993, 28% in the last five years; mostly in Computer Science; Wikidata
Seminal references
R packages
- R
ggraph::geom_node_circle(); GitHub 1 121 stars; last commit 2025-08
R code of the ggplot2 example
library(ggplot2)
library(dplyr)
library(gapminder)
library(ggraph)
library(tidygraph)
## A three-level tree: the world, its continents, their countries.
countries <- gapminder |>
filter(year == 2007) |>
transmute(name = as.character(country), continent, pop) |>
arrange(continent, desc(pop))
nodes <- bind_rows(tibble(name = "World", pop = 0),
tibble(name = levels(countries$continent), continent = levels(countries$continent), pop = 0),
countries)
edges <- bind_rows(tibble(from = "World", to = levels(countries$continent)),
tibble(from = as.character(countries$continent), to = countries$name))
world <- tbl_graph(nodes = nodes, edges = edges, node_key = "name")
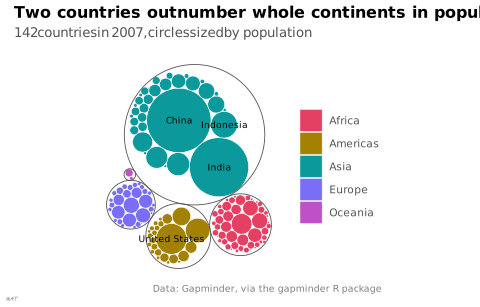
## Countries of over 200 million people are named.
p <- ggraph(world, layout = "circlepack", weight = pop) +
geom_node_circle(aes(filter = depth == 2, fill = continent), colour = "white", linewidth = 0.2) +
geom_node_circle(aes(filter = depth == 1), colour = "#535353", linewidth = 0.3) +
geom_node_text(aes(filter = depth == 2 & pop > 2e8, label = name), size = 2.4) +
scale_fill_manual(values = continent_colors) +
coord_equal() +
labs(title = "Two countries outnumber whole continents in population",
subtitle = "142 countries in 2007, circles sized by population",
fill = NULL,
caption = "Data: Gapminder, via the gapminder R package") +
theme_lex_viz(grid = "", arrows = "") +
theme(legend.position = "right", axis.text = element_blank(), axis.title = element_blank())Sources (11)
34 occurrences in the corpus; indexed by 3 books
Show the 11 sources
- Atlas of knowledge: anyone can map
- Bremer & Barone, Chart, CRC Press, 2025
- Data visualisation: a handbook for data driven design
- data-to-viz.com
- From data to viz
- Info we trust: how to inspire the world with data
- The book of circles: visualizing spheres of knowledge
- The book of trees: visualizing branches of knowledge
- Visualization of Time-Oriented Data
- Visualize This
- Wikipedia in English↗
Cite this entry
Stable addresshttps://dataviz.adrientaudiere.com/en-only/term/circle-packing.html
ReferenceTaudière Adrien. 2026. circle packing. In Visualization Vocabulary, version 1.0.0. IdEst. https://dataviz.adrientaudiere.com/en-only/term/circle-packing.html
BibTeX
@incollection{taudiere2026-circle-packing,
  author    = {Taudière, Adrien},
  title     = {circle packing},
  booktitle = {Visualization Vocabulary},
  year      = {2026},
  version   = {1.0.0},
  publisher = {IdEst},
  url       = {https://dataviz.adrientaudiere.com/en-only/term/circle-packing.html},
  note      = {CC0 1.0}
}Page created on 2026-10-13. Text last changed on 2026-11-12. Images last changed on 2026-11-12. Numbers computed on 2026-10-22.