
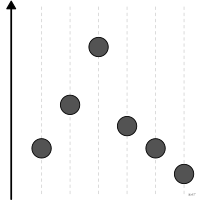
 chart
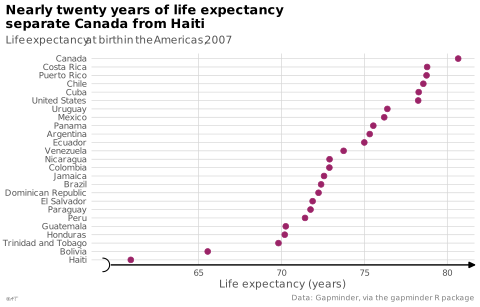
Cleveland dot plot
also: dot chartDots positioned on a shared axis against categories.
Classification
- chart
- bars › simple bars
- distribution; Financial Times Visual Vocabulary
- the name evokes: eponym
Channels
 position on common scale; main: value; Munzner 2014
 spatial region; main: category; Munzner 2014
 color hue; secondary: series; Munzner 2014
Variants
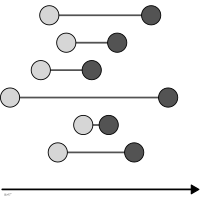 dumbbell charttwo connected dots
Attestation
- English definition: ggplot2 reference
Scientific literature
OpenAlex: 85 papers since 1981, 12% in the last five years; mostly in Computer Science, Medicine, Mathematics
Seminal references
R packages
- R
ggplot2::geom_point(); GitHub 7 025 stars; last commit 2026-10; paper (33 455 citations)
R code of the ggplot2 example
library(ggplot2)
library(dplyr)
library(gapminder)
americas <- gapminder |>
filter(continent == "Americas", year == 2007) |>
mutate(country = reorder(droplevels(country), lifeExp))
p <- ggplot(americas, aes(x = lifeExp, y = country)) +
geom_point(size = 1.8, colour = "#9b2367") +
scale_x_continuous(labels = lex_number, breaks = lex_break_breaks, expand = lex_break_expand) +
labs(title = "Nearly twenty years of life expectancy\nseparate Canada from Haiti",
subtitle = "Life expectancy at birth in the Americas, 2007",
x = "Life expectancy (years)", y = NULL,
caption = "Data: Gapminder, via the gapminder R package") +
theme_lex_viz(base_size = 8, grid = "xy", arrows = "x", break_not_zero = "x")Sources (15)
83 occurrences in the corpus; indexed by 2 books
Show the 15 sources
- analysisfunction.civilservice.gov.uk
- app.flourish.studio
- Atlas of knowledge: anyone can map
- Data visualisation: a handbook for data driven design
- data-to-viz.com
- Friendly & Wainer, A History of Data Visualization and Graphic Communication, Harvard University Press, 2021
- From data to viz
- ggplot2 reference
- Graphical Perception: Theory, Experimentation, and Application to the Development of Gr...
- How charts lie: getting smarter about visual information
- The art of insight: how great visualization designers think
- The elements of graphing data
- The functional art: an introduction to information graphics and visualization
- The Truthful Art: Data, Charts, and Maps for Communication
- Visualization Analysis and Design
Cite this entry
Stable addresshttps://dataviz.adrientaudiere.com/en-only/term/cleveland-dot-plot.html
ReferenceTaudière Adrien. 2026. Cleveland dot plot. In Visualization Vocabulary, version 1.0.0. IdEst. https://dataviz.adrientaudiere.com/en-only/term/cleveland-dot-plot.html
BibTeX
@incollection{taudiere2026-cleveland-dot-plot,
  author    = {Taudière, Adrien},
  title     = {Cleveland dot plot},
  booktitle = {Visualization Vocabulary},
  year      = {2026},
  version   = {1.0.0},
  publisher = {IdEst},
  url       = {https://dataviz.adrientaudiere.com/en-only/term/cleveland-dot-plot.html},
  note      = {CC0 1.0}
}Page created on 2026-10-13. Text last changed on 2026-11-12. Images last changed on 2026-11-12. Numbers computed on 2026-10-22.