
 chart
donut chart
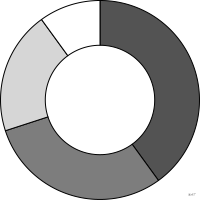
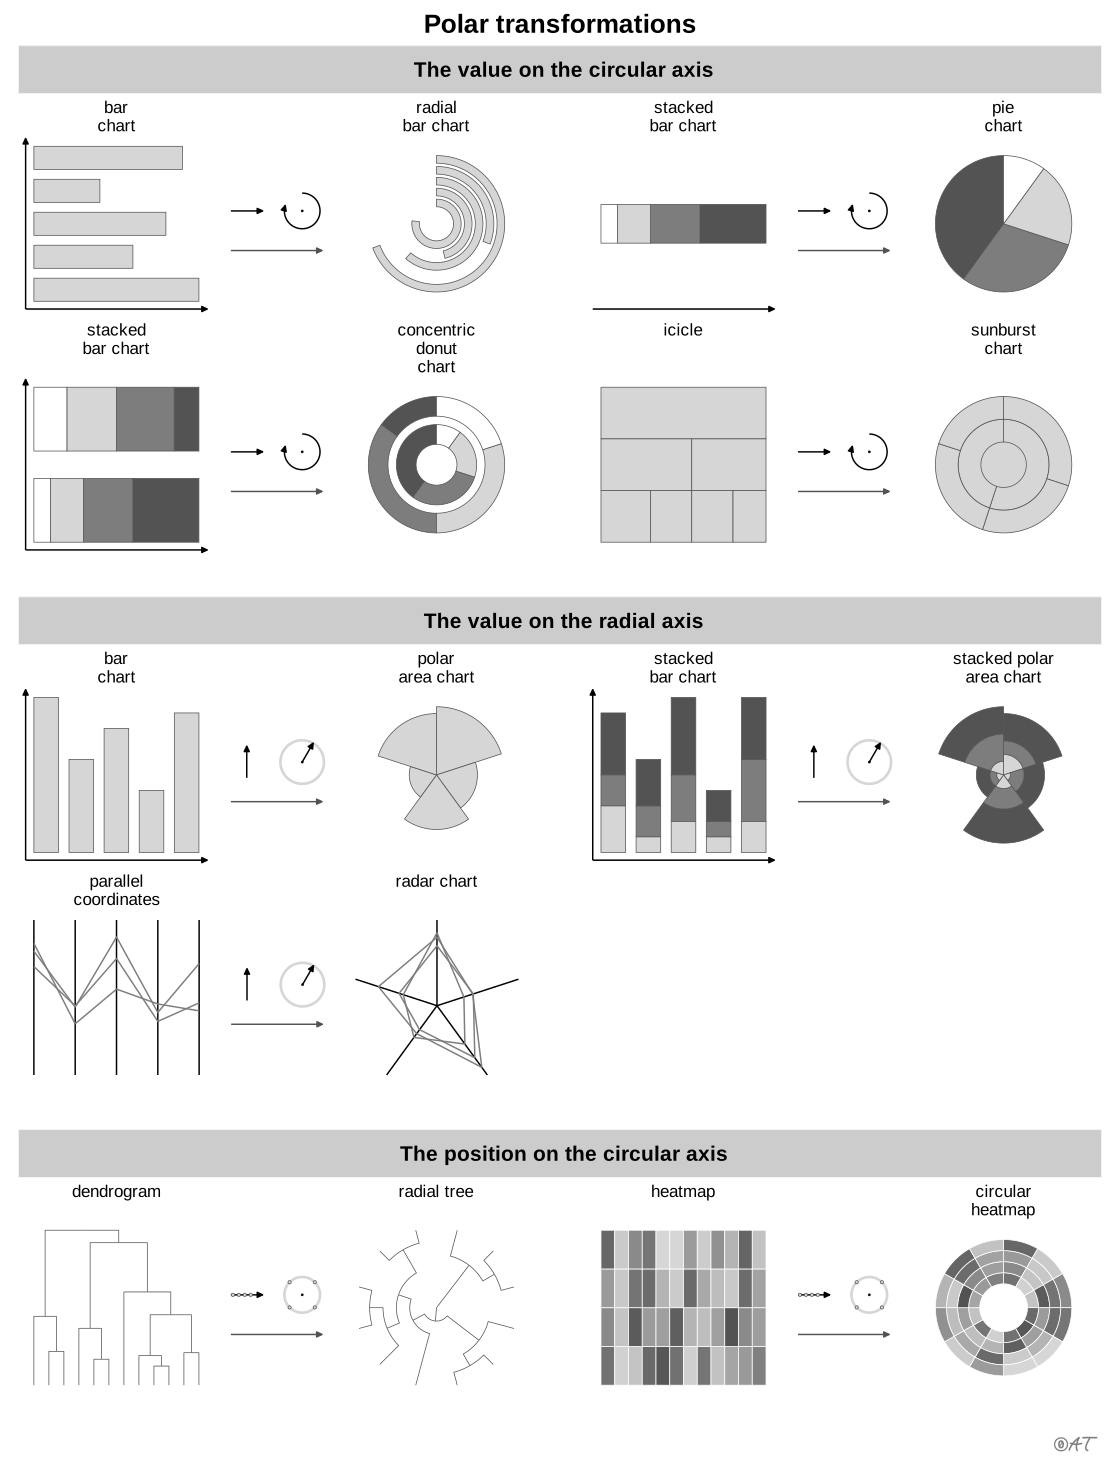
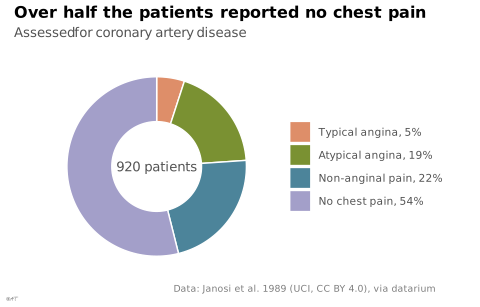
also: doughnut chartPie chart with a hole in the middle.
Classification
- chart
- sectors, tilings and units › sectors
- part-to-whole; Financial Times Visual Vocabulary
- the name evokes: food
Channels
 length; secondary: value
 tilt/angle; main: value (arc length, without the center)
 area; secondary: value
 color hue; main: category
Attestation
- English definition: Data Visualisation Guide, data.europa.eu
Scientific literature
OpenAlex: 152 papers since 2013, 66% in the last five years; mostly in Computer Science, Medicine, Business, Management and Accounting
Seminal references
R packages
- R
ggplot2::coord_radial(); GitHub 7 025 stars; last commit 2026-10; paper (33 455 citations) - R
donutsk::geom_donut_int(); GitHub 10 stars; last commit 2024-04; paper (0 citations)
R code of the ggplot2 example
library(ggplot2)
library(dplyr)
library(datarium)
## Chest pain type, coded 1 to 4 in the UCI files. Four types: a legend,
## with the share of each.
pain <- heartdisease |>
count(cp) |>
mutate(type = c("Typical angina", "Atypical angina", "Non-anginal pain", "No chest pain")[cp],
type = paste0(type, ", ", scales::percent(n / sum(n), accuracy = 1)),
type = factor(type, levels = type))
p <- ggplot(pain, aes(x = 2, y = n, fill = type)) +
geom_col(width = 1, colour = "white", linewidth = 0.5) +
annotate("text", x = 0.5, y = 0, label = paste(sum(pain$n), "patients"),
size = 3.5, colour = "#535353") +
coord_radial(theta = "y", reverse = "theta", expand = FALSE) +
scale_x_continuous(limits = c(0.5, 2.5)) +
labs(title = "Over half the patients reported no chest pain",
subtitle = "Assessed for coronary artery disease",
x = NULL, y = NULL, fill = NULL,
caption = "Data: Janosi et al. 1989 (UCI, CC BY 4.0), via datarium") +
theme_lex_viz(grid = "", arrows = "") +
theme(legend.position = "right", axis.text = element_blank())Sources (25)
83 occurrences in the corpus; indexed by 8 books
Show the 25 sources
- analysisfunction.civilservice.gov.uk
- app.flourish.studio
- Atlas of knowledge: anyone can map
- Better data visualizations: a guide for scholars, researchers, and wonks
- Bremer & Barone, Chart, CRC Press, 2025
- Data points: visualization that means something
- Data sketches
- Data Visualisation Guide, data.europa.eu
- Data visualisation: a handbook for data driven design
- Data visualization handbook
- Data Viz Project
- dataphys.org
- datavizcatalogue.com
- datavizproject.com
- datawrapper.de↗
- Effective data storytelling: how to drive change with data, narrative, and visuals
- Effective data visualization: the right chart for the right data
- Exploratory Data Analysis: Descriptive Analysis, Visualization, and Dashboard Design (w...
- Information Graphics: A Comprehensive Illustrated Reference
- Practical charts: the essential guide to creating clear, compelling charts for reports ...
- Show me the numbers: designing tables and graphs to enlighten
- The big book of dashboards: visualizing your data using real-world business scenarios
- The grammar of graphics
- Visualize This
- Wikipedia in English↗
Cite this entry
Stable addresshttps://dataviz.adrientaudiere.com/en-only/term/donut-chart.html
ReferenceTaudière Adrien. 2026. donut chart. In Visualization Vocabulary, version 1.0.0. IdEst. https://dataviz.adrientaudiere.com/en-only/term/donut-chart.html
BibTeX
@incollection{taudiere2026-donut-chart,
  author    = {Taudière, Adrien},
  title     = {donut chart},
  booktitle = {Visualization Vocabulary},
  year      = {2026},
  version   = {1.0.0},
  publisher = {IdEst},
  url       = {https://dataviz.adrientaudiere.com/en-only/term/donut-chart.html},
  note      = {CC0 1.0}
}Page created on 2026-10-13. Text last changed on 2026-11-10. Images last changed on 2026-11-12. Numbers computed on 2026-10-22.