
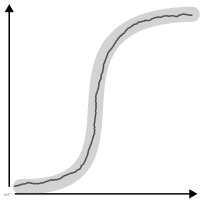
 chart
empirical cumulative distribution function
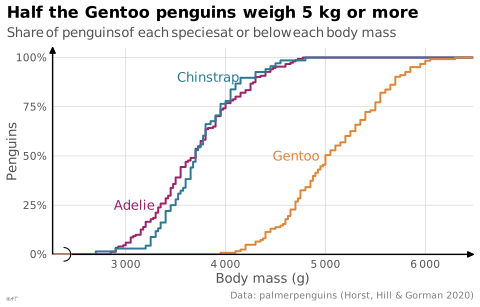
also: ECDF plotCurve giving the share of observations below each value.
Classification
- chart
- lines and areas › statistical curves
- distribution; Financial Times Visual Vocabulary
Channels
 position on common scale; main: cumulative proportion
Scientific literature
OpenAlex: 35 papers since 2008, 51% in the last five years; mostly in Computer Science, Mathematics, Medicine
R packages
- R
ggplot2::stat_ecdf(); GitHub 7 025 stars; last commit 2026-10; paper (33 455 citations) - R
mountainplot::mountainplot(); GitHub 1 stars; last commit 2025-10; paper (0 citations)
R code of the ggplot2 example
library(ggplot2)
library(dplyr)
library(palmerpenguins)
## Each name goes left of its curve, at a height where no other curve passes.
labels <- penguins |>
filter(!is.na(body_mass_g)) |>
mutate(y = c(Adelie = 0.25, Chinstrap = 0.9, Gentoo = 0.5)[as.character(species)]) |>
group_by(species) |>
summarise(y = first(y), x = quantile(body_mass_g, y))
p <- ggplot(penguins, aes(x = body_mass_g, colour = species)) +
stat_ecdf(linewidth = 0.7, na.rm = TRUE) +
geom_text(data = labels, aes(x = x, y = y, label = species),
hjust = 1, nudge_x = -60, size = 3.5) +
scale_x_continuous(labels = lex_number, breaks = lex_break_breaks, expand = lex_break_expand) +
scale_y_continuous(labels = scales::label_percent(), expand = expansion(mult = c(0, 0.05))) +
labs(title = "Half the Gentoo penguins weigh 5 kg or more",
subtitle = "Share of penguins of each species at or below each body mass",
x = "Body mass (g)", y = "Penguins",
caption = "Data: palmerpenguins (Horst, Hill & Gorman 2020)") +
theme_lex_viz(break_not_zero = "x") +
theme(legend.position = "none")Sources (4)
3 occurrences in the corpus
Cite this entry
Stable addresshttps://dataviz.adrientaudiere.com/en-only/term/ecdf-plot.html
ReferenceTaudière Adrien. 2026. empirical cumulative distribution function. In Visualization Vocabulary, version 1.0.0. IdEst. https://dataviz.adrientaudiere.com/en-only/term/ecdf-plot.html
BibTeX
@incollection{taudiere2026-ecdf-plot,
  author    = {Taudière, Adrien},
  title     = {empirical cumulative distribution function},
  booktitle = {Visualization Vocabulary},
  year      = {2026},
  version   = {1.0.0},
  publisher = {IdEst},
  url       = {https://dataviz.adrientaudiere.com/en-only/term/ecdf-plot.html},
  note      = {CC0 1.0}
}Page created on 2026-10-13. Text last changed on 2026-10-22. Images last changed on 2026-11-12. Numbers computed on 2026-10-22.