
 chart
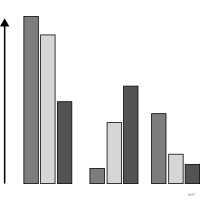
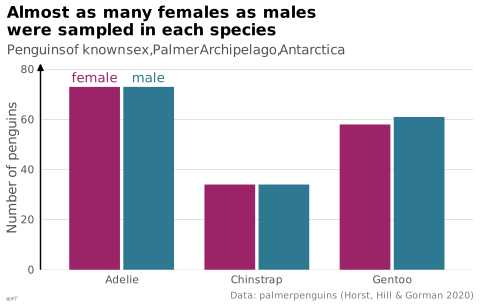
grouped bar chart
also: multi-set bar chart, clustered bar chart, paired column, paired barBars juxtaposed within groups to compare several series.
Classification
- chart
- bars › grouped or stacked bars
- magnitude; Financial Times Visual Vocabulary
Channels
 position on common scale; main: value; Munzner 2014
 length; main: value; Munzner 2014
 spatial region; main: group, then series within the group; Munzner 2014
 color hue; secondary: series; Munzner 2014
Attestation
- English definition: Data Visualisation Guide, data.europa.eu
Scientific literature
OpenAlex: 120 papers since 2008, 62% in the last five years; mostly in Computer Science, Medicine, Social Sciences
Seminal references
- first known use (1786) Playfair (1786). The Commercial and Political Atlas; Tufte 2001
R packages
- R
ggplot2::position_dodge(); GitHub 7 025 stars; last commit 2026-10; paper (33 455 citations)
R code of the ggplot2 example
library(ggplot2)
library(dplyr)
library(palmerpenguins)
counts <- penguins |>
filter(!is.na(sex)) |>
count(species, sex)
dodge <- position_dodge(width = 0.8)
p <- ggplot(counts, aes(x = species, y = n, fill = sex, group = sex)) +
geom_col(width = 0.75, position = dodge) +
geom_text(data = filter(counts, species == "Adelie"), aes(label = sex, colour = sex),
position = dodge, vjust = -0.5, size = 3.5) +
scale_y_continuous(labels = lex_number, expand = expansion(mult = c(0, 0.12))) +
labs(title = "Almost as many females as males\nwere sampled in each species",
subtitle = "Penguins of known sex, Palmer Archipelago, Antarctica",
x = NULL, y = "Number of penguins",
caption = "Data: palmerpenguins (Horst, Hill & Gorman 2020)") +
theme_lex_viz(grid = "y", arrows = "y") +
theme(legend.position = "none")Sources (18)
105 occurrences in the corpus; indexed by 5 books
Show the 18 sources
- Atlas of knowledge: anyone can map
- Better data visualizations: a guide for scholars, researchers, and wonks
- Data Visualisation Guide, data.europa.eu
- Data visualisation: a handbook for data driven design
- Data visualization handbook
- Data Viz Project
- datavizproject.com
- Effective data storytelling: how to drive change with data, narrative, and visuals
- Effective data visualization: the right chart for the right data
- Exploratory Data Analysis: Descriptive Analysis, Visualization, and Dashboard Design (w...
- Graphical Perception: Theory, Experimentation, and Application to the Development of Gr...
- Information Graphics: A Comprehensive Illustrated Reference
- Interactive data visualization: foundations, techniques, and applications
- Practical charts: the essential guide to creating clear, compelling charts for reports ...
- The golden age of data visualization: how did we get here?
- The grammar of graphics
- Visual strategies for biological data
- Visualization Analysis and Design
Cite this entry
Stable addresshttps://dataviz.adrientaudiere.com/en-only/term/grouped-bar-chart.html
ReferenceTaudière Adrien. 2026. grouped bar chart. In Visualization Vocabulary, version 1.0.0. IdEst. https://dataviz.adrientaudiere.com/en-only/term/grouped-bar-chart.html
BibTeX
@incollection{taudiere2026-grouped-bar-chart,
  author    = {Taudière, Adrien},
  title     = {grouped bar chart},
  booktitle = {Visualization Vocabulary},
  year      = {2026},
  version   = {1.0.0},
  publisher = {IdEst},
  url       = {https://dataviz.adrientaudiere.com/en-only/term/grouped-bar-chart.html},
  note      = {CC0 1.0}
}Page created on 2026-10-13. Text last changed on 2026-10-22. Images last changed on 2026-11-12. Numbers computed on 2026-10-22.