
 chart
horizon chart
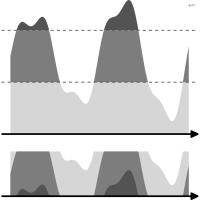
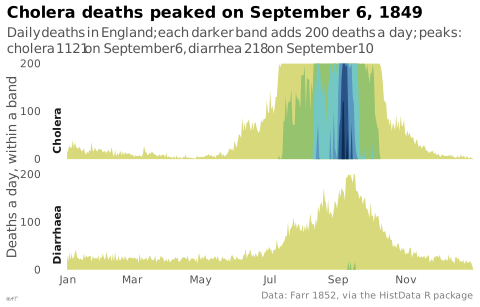
Time series folded into colored bands to save vertical space.
Classification
- chart
- lines and areas › areas
- change over time
- the name evokes: nature
Channels
 position on unaligned scale; main: value
 color luminance; secondary: magnitude (overlapping bands, increasingly darker)
 color saturation; secondary: magnitude (instead of luminance)
 spatial region; main: series
 color hue; main: series
Attestation
- English definition: Data Visualisation Guide, data.europa.eu
Scientific literature
OpenAlex: 56 papers since 2013, 48% in the last five years; mostly in Computer Science, Engineering, Physics and Astronomy; Wikidata
Seminal references
R packages
- R
ggHoriPlot::geom_horizon(); GitHub 152 stars; last commit 2024-07
R code of the ggplot2 example
library(ggplot2)
library(dplyr)
library(tidyr)
library(HistData)
## Each series cut into bands of 200 deaths a day, laid on top of each
## other: the darker the band, the higher the count.
band <- 200
bands <- CholeraDeaths1849 |>
select(date, cause_of_death, deaths) |>
expand_grid(level = 1:6) |>
mutate(height = pmin(pmax(deaths - (level - 1) * band, 0), band)) |>
filter(level <= ceiling(max(deaths) / band))
p <- ggplot(bands, aes(x = date, ymin = 0, ymax = height, fill = factor(level))) +
geom_ribbon() +
facet_wrap(~cause_of_death, ncol = 1, strip.position = "left") +
scale_fill_manual(values = idest_seq) +
scale_x_date(date_breaks = "2 months", labels = scales::label_date("%b", locale = "en"),
expand = c(0, 0)) +
scale_y_continuous("Deaths a day, within a band", breaks = c(0, 100, 200), expand = c(0, 0)) +
labs(title = "Cholera deaths peaked on September 6, 1849",
subtitle = "Daily deaths in England; each darker band adds 200 deaths a day; peaks: cholera 1\u2009121 on September 6, diarrhea 218 on September 10",
x = NULL,
caption = "Data: Farr 1852, via the HistData R package") +
theme_lex_viz(grid = "", arrows = "") +
theme(legend.position = "none", panel.spacing = unit(4, "mm"))Sources (8)
20 occurrences in the corpus; indexed by 2 books
- app.flourish.studio
- Better data visualizations: a guide for scholars, researchers, and wonks
- Data Visualisation Guide, data.europa.eu
- Data visualisation: a handbook for data driven design
- The Truthful Art: Data, Charts, and Maps for Communication
- The Wall Street journal guide to information graphics: the dos and don'ts of presenting...
- Wikipedia in English↗
- xeno.graphics↗
Cite this entry
Stable addresshttps://dataviz.adrientaudiere.com/en-only/term/horizon-chart.html
ReferenceTaudière Adrien. 2026. horizon chart. In Visualization Vocabulary, version 1.0.0. IdEst. https://dataviz.adrientaudiere.com/en-only/term/horizon-chart.html
BibTeX
@incollection{taudiere2026-horizon-chart,
  author    = {Taudière, Adrien},
  title     = {horizon chart},
  booktitle = {Visualization Vocabulary},
  year      = {2026},
  version   = {1.0.0},
  publisher = {IdEst},
  url       = {https://dataviz.adrientaudiere.com/en-only/term/horizon-chart.html},
  note      = {CC0 1.0}
}Page created on 2026-10-13. Text last changed on 2026-11-02. Images last changed on 2026-11-12. Numbers computed on 2026-10-22.