
 chart
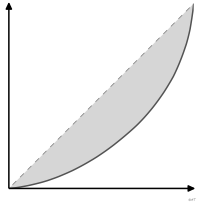
Lorenz curve
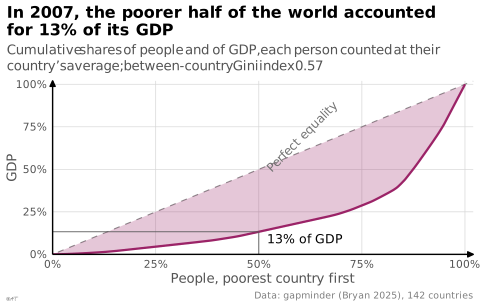
Curve giving, for each cumulative share of the population, the cumulative share of a quantity it holds, such as income.
Classification
- chart
- lines and areas › statistical curves
- distribution
- the name evokes: eponym
Channels
 position on common scale; main: cumulative share of the population; cumulative share of the quantity
 area; secondary: concentration (area between the curve and the diagonal)
Attestation
- English definition: Cartography: thematic map design
Scientific literature
R code of the ggplot2 example
library(ggplot2)
library(dplyr)
library(gapminder)
## Countries ranked from the lowest to the highest GDP per capita; each
## person counts at their country's average, so the curve ignores the
## inequality inside each country.
lorenz <- gapminder |>
filter(year == 2007) |>
mutate(pop = as.numeric(pop), gdp = gdpPercap * pop) |>
arrange(gdpPercap) |>
mutate(people = cumsum(pop) / sum(pop), wealth = cumsum(gdp) / sum(gdp))
lorenz <- bind_rows(tibble(people = 0, wealth = 0), lorenz)
half <- approx(lorenz$people, lorenz$wealth, xout = 0.5)$y
p <- ggplot(lorenz, aes(x = people, y = wealth)) +
geom_abline(slope = 1, intercept = 0, linetype = "dashed", colour = "grey55", linewidth = 0.4) +
geom_ribbon(aes(ymin = wealth, ymax = people), fill = lex_colors[["plum"]], alpha = 0.25) +
geom_line(colour = lex_colors[["plum"]], linewidth = 0.8) +
annotate("segment", x = 0.5, xend = 0.5, y = 0, yend = half, colour = "grey35", linewidth = 0.3) +
annotate("segment", x = 0, xend = 0.5, y = half, yend = half, colour = "grey35", linewidth = 0.3) +
annotate("text", x = 0.52, y = half, label = "13% of GDP", hjust = 0, vjust = 1.3, size = 3.3) +
annotate("text", x = 0.62, y = 0.66, label = "Perfect equality", angle = 45, size = 3.2,
colour = "grey45", vjust = -0.5) +
scale_x_continuous(labels = scales::label_percent(), expand = expansion(mult = c(0, 0.02))) +
scale_y_continuous(labels = scales::label_percent(), expand = expansion(mult = c(0, 0.02))) +
labs(title = "In 2007, the poorer half of the world accounted\nfor 13% of its GDP",
subtitle = "Cumulative shares of people and of GDP, each person counted at their\ncountry's average; between-country Gini index 0.57",
x = "People, poorest country first", y = "GDP",
caption = "Data: gapminder (Bryan 2025), 142 countries") +
theme_lex_viz()Sources (4)
11 occurrences in the corpus; indexed by 3 books
Cite this entry
Stable addresshttps://dataviz.adrientaudiere.com/en-only/term/lorenz-curve.html
ReferenceTaudière Adrien. 2026. Lorenz curve. In Visualization Vocabulary, version 1.0.0. IdEst. https://dataviz.adrientaudiere.com/en-only/term/lorenz-curve.html
BibTeX
@incollection{taudiere2026-lorenz-curve,
  author    = {Taudière, Adrien},
  title     = {Lorenz curve},
  booktitle = {Visualization Vocabulary},
  year      = {2026},
  version   = {1.0.0},
  publisher = {IdEst},
  url       = {https://dataviz.adrientaudiere.com/en-only/term/lorenz-curve.html},
  note      = {CC0 1.0}
}Page created on 2026-11-10. Text last changed on 2026-11-12. Images last changed on 2026-11-11. Numbers computed on 2026-10-22.