
 chart
organizational chart
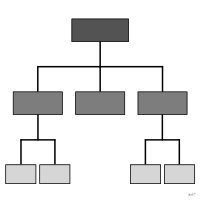
Tree of reporting lines within an organization.
Classification
- chart
- networks and trees › hierarchical trees
Channels
 spatial region; main: hierarchical level
 color hue; secondary: group
 shape; secondary: group
Scientific literature
OpenAlex: 2 428 papers since 1912, 28% in the last five years; mostly in Social Sciences, Business, Management and Accounting, Medicine; Wikidata
Seminal references
R packages
- R
ggdendro::ggdendrogram(); GitHub 90 stars; last commit 2025-11
R code of the ggplot2 example
library(ggplot2)
library(dplyr)
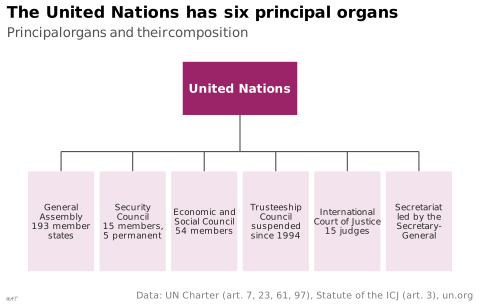
## The six principal organs of the United Nations (Charter, article 7),
## each with its membership; connectors drawn as elbows.
organs <- tibble(
label = c("General\nAssembly\n193 member\nstates", "Security\nCouncil\n15 members,\n5 permanent",
"Economic and\nSocial Council\n54 members", "Trusteeship\nCouncil\nsuspended\nsince 1994",
"International\nCourt of Justice\n15 judges", "Secretariat\nled by the\nSecretary-\nGeneral"),
x = seq(-5, 5, 2), y = 0
)
p <- ggplot(organs) +
annotate("segment", x = 0, xend = 0, y = 1.6, yend = 1.05, colour = "#535353", linewidth = 0.4) +
annotate("segment", x = -5, xend = 5, y = 1.05, yend = 1.05, colour = "#535353", linewidth = 0.4) +
geom_segment(aes(x = x, xend = x, y = 1.05, yend = 0.75), colour = "#535353", linewidth = 0.4) +
annotate("tile", x = 0, y = 2, width = 3.2, height = 0.8, fill = "#9b2367") +
annotate("text", x = 0, y = 2, label = "United Nations", colour = "white", fontface = "bold", size = 3.2) +
geom_tile(aes(x = x, y = y, width = 1.85, height = 1.5), fill = "#f3e3ec") +
geom_text(aes(x = x, y = y, label = label), size = 2.3, lineheight = 0.9, colour = "#262626") +
scale_y_continuous(limits = c(-0.8, 2.45)) +
labs(title = "The United Nations has six principal organs",
subtitle = "Principal organs and their composition",
x = NULL, y = NULL,
caption = "Data: UN Charter (art. 7, 23, 61, 97), Statute of the ICJ (art. 3), un.org") +
theme_lex_viz(grid = "", arrows = "") +
theme(axis.text = element_blank())Sources (12)
9 occurrences in the corpus; indexed by 5 books
Show the 12 sources
- Better data visualizations: a guide for scholars, researchers, and wonks
- Building Science Graphics: An Illustrated Guide to Communicating Science through Diagra...
- Data visualization handbook
- Info we trust: how to inspire the world with data
- Information Graphics: A Comprehensive Illustrated Reference
- Interactive data visualization: foundations, techniques, and applications
- The book of circles: visualizing spheres of knowledge
- The book of trees: visualizing branches of knowledge
- The Wall Street journal guide to information graphics: the dos and don'ts of presenting...
- Visual complexity: mapping patterns of information
- Wikipedia — Data and information visualization
- Wikipedia in English↗
Cite this entry
Stable addresshttps://dataviz.adrientaudiere.com/en-only/term/org-chart.html
ReferenceTaudière Adrien. 2026. organizational chart. In Visualization Vocabulary, version 1.0.0. IdEst. https://dataviz.adrientaudiere.com/en-only/term/org-chart.html
BibTeX
@incollection{taudiere2026-org-chart,
  author    = {Taudière, Adrien},
  title     = {organizational chart},
  booktitle = {Visualization Vocabulary},
  year      = {2026},
  version   = {1.0.0},
  publisher = {IdEst},
  url       = {https://dataviz.adrientaudiere.com/en-only/term/org-chart.html},
  note      = {CC0 1.0}
}Page created on 2026-10-13. Text last changed on 2026-11-02. Images last changed on 2026-11-02. Numbers computed on 2026-10-22.