

 chart
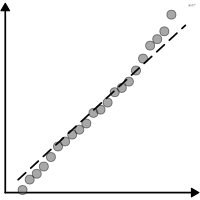
quantile-quantile plot
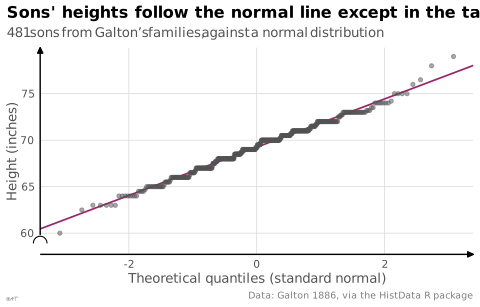
also: QQ plotComparison of observed quantiles to a theoretical distribution.
Classification
- chart
- points and bubbles › scatterplots
- distribution
Channels
 position on common scale; main: observed and theoretical quantiles
Attestation
- English definition: ggplot2 reference
Scientific literature
OpenAlex: 1 264 papers since 1980, 38% in the last five years; mostly in Mathematics, Biochemistry, Genetics and Molecular Biology, Medicine; Wikidata
Seminal references
- formalization (1968) WILK & GNANADESIKAN (1968). Probability plotting methods for the analysis for the analysis of data. Biometrika (1 498 citations)
R packages
- R
ggplot2::geom_qq(); GitHub 7 025 stars; last commit 2026-10; paper (33 455 citations) - R
qqman::qq(); GitHub 175 stars; last commit 2023-08; paper (1 135 citations) - R
qqplotr::geom_qq_band(); GitHub 51 stars; last commit 2026-06; paper (58 citations)
R code of the ggplot2 example
library(ggplot2)
library(dplyr)
library(HistData)
sons <- GaltonFamilies |>
filter(gender == "male")
p <- ggplot(sons, aes(sample = childHeight)) +
geom_qq_line(colour = "#9b2367", linewidth = 0.6) +
geom_qq(size = 1.2, alpha = 0.5, colour = "#535353") +
scale_y_continuous(labels = lex_number, breaks = lex_break_breaks, expand = lex_break_expand) +
labs(title = "Sons' heights follow the normal line except in the tails",
subtitle = "481 sons from Galton's families, against a normal distribution",
x = "Theoretical quantiles (standard normal)", y = "Height (inches)",
caption = "Data: Galton 1886, via the HistData R package") +
theme_lex_viz(break_not_zero = "y")Sources (3)
7 occurrences in the corpus
Cite this entry
Stable addresshttps://dataviz.adrientaudiere.com/en-only/term/qq-plot.html
ReferenceTaudière Adrien. 2026. quantile-quantile plot. In Visualization Vocabulary, version 1.0.0. IdEst. https://dataviz.adrientaudiere.com/en-only/term/qq-plot.html
BibTeX
@incollection{taudiere2026-qq-plot,
  author    = {Taudière, Adrien},
  title     = {quantile-quantile plot},
  booktitle = {Visualization Vocabulary},
  year      = {2026},
  version   = {1.0.0},
  publisher = {IdEst},
  url       = {https://dataviz.adrientaudiere.com/en-only/term/qq-plot.html},
  note      = {CC0 1.0}
}Page created on 2026-10-13. Text last changed on 2026-10-22. Images last changed on 2026-11-09. Numbers computed on 2026-10-22.