

 chart
radial bar chart
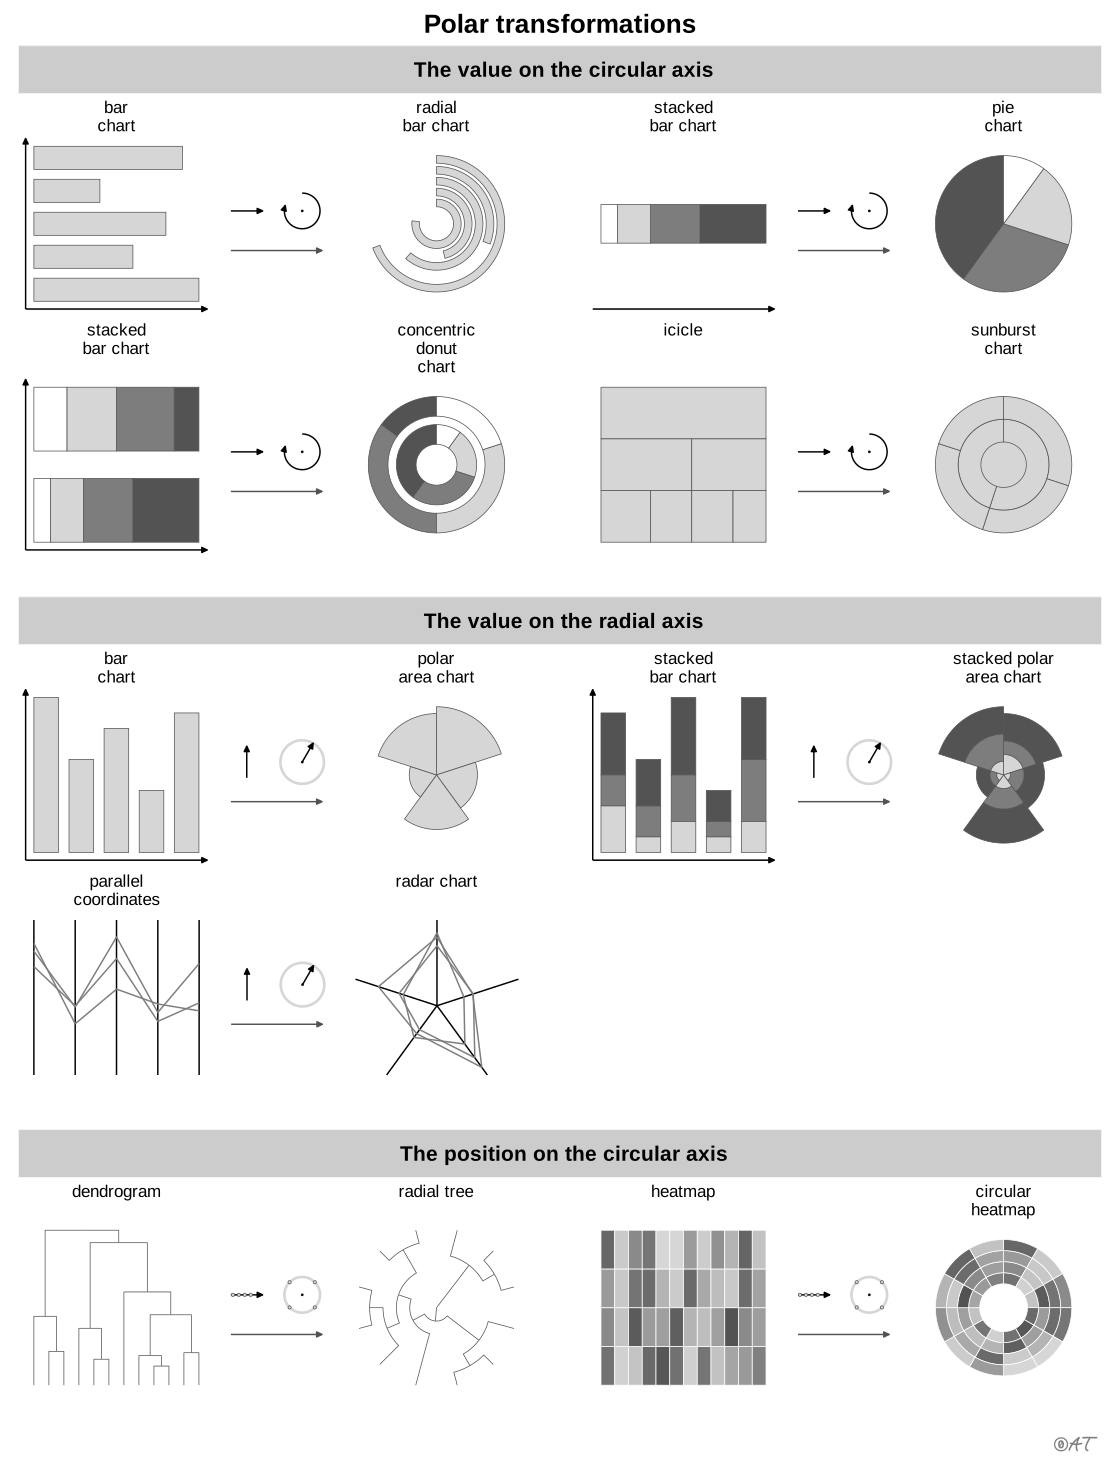
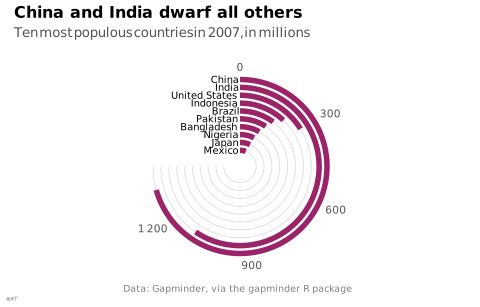
also: circular bar chart, radial chartBars laid out along a circular axis.
Classification
- chart
- radial › polar bars
- magnitude
Channels
 length; main: value (Munzner: length encoding of line marks); Munzner 2014
 spatial region; main: category; Munzner 2014
Scientific literature
OpenAlex: 13 papers since 2021, 54% in the last five years; mostly in Computer Science, Engineering, Mathematics
R packages
- R
ggplot2::coord_radial(); GitHub 7 025 stars; last commit 2026-10; paper (33 455 citations)
R code of the ggplot2 example
library(ggplot2)
library(dplyr)
library(gapminder)
largest <- gapminder |>
filter(year == 2007) |>
slice_max(pop, n = 10) |>
mutate(country = reorder(droplevels(country), pop),
pop = pop / 1e6)
p <- ggplot(largest, aes(x = country, y = pop)) +
geom_col(width = 0.7, fill = "#9b2367") +
geom_text(aes(y = 0, label = country), hjust = 1.05, size = 2.6) +
scale_y_continuous(labels = lex_number, breaks = seq(0, 1200, 300), limits = c(0, 1400), expand = c(0, 0)) +
coord_radial(theta = "y", end = 1.5 * pi, inner.radius = 0.15, expand = FALSE) +
guides(r = "none") +
labs(title = "China and India dwarf all others",
subtitle = "Ten most populous countries in 2007, in millions",
x = NULL, y = NULL,
caption = "Data: Gapminder, via the gapminder R package") +
theme_lex_viz(grid = "x", arrows = "")Sources (15)
27 occurrences in the corpus; indexed by 5 books
Show the 15 sources
- app.flourish.studio
- Better data visualizations: a guide for scholars, researchers, and wonks
- Bremer & Barone, Chart, CRC Press, 2025
- Data Viz Project
- datavizproject.com
- Effective data storytelling: how to drive change with data, narrative, and visuals
- Exploratory Data Analysis: Descriptive Analysis, Visualization, and Dashboard Design (w...
- Friendly & Wainer, A History of Data Visualization and Graphic Communication, Harvard University Press, 2021
- Info we trust: how to inspire the world with data
- Information Graphics: A Comprehensive Illustrated Reference
- Questions in Dataviz: A Design-Driven Process for Data Visualisation
- The big book of dashboards: visualizing your data using real-world business scenarios
- The book of circles: visualizing spheres of knowledge
- The book of trees: visualizing branches of knowledge
- Visualization Analysis and Design
Cite this entry
Stable addresshttps://dataviz.adrientaudiere.com/en-only/term/radial-bar-chart.html
ReferenceTaudière Adrien. 2026. radial bar chart. In Visualization Vocabulary, version 1.0.0. IdEst. https://dataviz.adrientaudiere.com/en-only/term/radial-bar-chart.html
BibTeX
@incollection{taudiere2026-radial-bar-chart,
  author    = {Taudière, Adrien},
  title     = {radial bar chart},
  booktitle = {Visualization Vocabulary},
  year      = {2026},
  version   = {1.0.0},
  publisher = {IdEst},
  url       = {https://dataviz.adrientaudiere.com/en-only/term/radial-bar-chart.html},
  note      = {CC0 1.0}
}Page created on 2026-10-13. Text last changed on 2026-11-12. Images last changed on 2026-11-11. Numbers computed on 2026-10-22.