
 chart
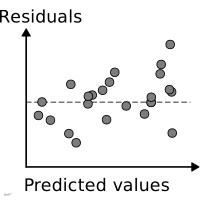
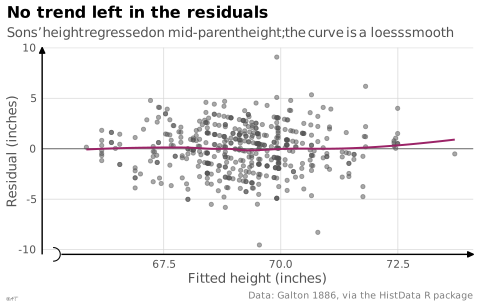
residual plot
Model residuals plotted against fitted values.
Classification
- chart
- points and bubbles › scatterplots
- deviation
Channels
 position on common scale; main: residual; fitted value on the x-axis
Scientific literature
OpenAlex: 1 534 papers since 1973, 35% in the last five years; mostly in Mathematics, Engineering, Medicine
Seminal references
- first known use (1924) Ezekiel (1924). A method of handling curvilinear correlation for any number of variables. Journal of the American Statistical Association (83 citations); Friendly & Denis 2001
R packages
- R
ggResidpanel::resid_panel(); GitHub 36 stars; last commit 2026-09 - R
bivrp::bivrp(); paper (6 citations)
R code of the ggplot2 example
library(ggplot2)
library(dplyr)
library(HistData)
sons <- GaltonFamilies |>
filter(gender == "male")
fit <- lm(childHeight ~ midparentHeight, data = sons)
sons <- sons |>
mutate(fitted = fitted(fit), residual = resid(fit))
p <- ggplot(sons, aes(x = fitted, y = residual)) +
geom_hline(yintercept = 0, colour = "#7d7d7d", linewidth = 0.4) +
geom_point(size = 1.2, alpha = 0.5, colour = "#535353") +
geom_smooth(method = "loess", formula = y ~ x, se = FALSE, colour = "#9b2367", linewidth = 0.7) +
scale_x_continuous(labels = lex_number, breaks = lex_break_breaks, expand = lex_break_expand) +
scale_y_continuous(labels = lex_number) +
labs(title = "No trend left in the residuals",
subtitle = "Sons' height regressed on mid-parent height; the curve is a loess smooth",
x = "Fitted height (inches)", y = "Residual (inches)",
caption = "Data: Galton 1886, via the HistData R package") +
theme_lex_viz(break_not_zero = "x")Sources (1)
3 occurrences in the corpus
Cite this entry
Stable addresshttps://dataviz.adrientaudiere.com/en-only/term/residual-plot.html
ReferenceTaudière Adrien. 2026. residual plot. In Visualization Vocabulary, version 1.0.0. IdEst. https://dataviz.adrientaudiere.com/en-only/term/residual-plot.html
BibTeX
@incollection{taudiere2026-residual-plot,
  author    = {Taudière, Adrien},
  title     = {residual plot},
  booktitle = {Visualization Vocabulary},
  year      = {2026},
  version   = {1.0.0},
  publisher = {IdEst},
  url       = {https://dataviz.adrientaudiere.com/en-only/term/residual-plot.html},
  note      = {CC0 1.0}
}Page created on 2026-10-13. Text last changed on 2026-10-22. Images last changed on 2026-11-09. Numbers computed on 2026-10-22.