
 chart
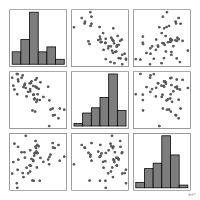
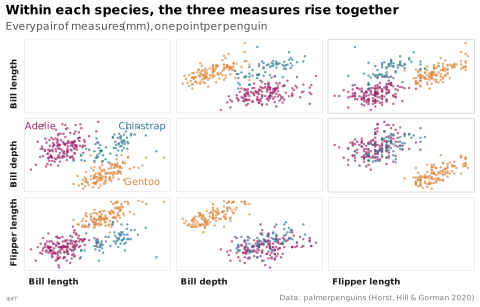
scatterplot matrix
also: SPLOM, pairs plotGrid of all pairwise scatterplots.
Classification
- chart
- points and bubbles › scatterplots
- correlation
Channels
 position on common scale; main: values in each cell; Munzner 2014
 spatial region; main: pair of variables; Munzner 2014
Attestation
- English definition: The elements of graphing data
Scientific literature
OpenAlex: 231 papers since 1989, 26% in the last five years; mostly in Computer Science, Mathematics, Agricultural and Biological Sciences
Seminal references
- first known use (1975) Hartigan (1975). Printer graphics for clustering. Journal of Statistical Computation and Simulation (154 citations); Friendly & Denis 2001
R packages
- R
GGally::ggscatmat(); GitHub 617 stars; last commit 2026-10 - R
gpairs::gpairs(); paper (3 citations)
R code of the ggplot2 example
library(ggplot2)
library(dplyr)
library(tidyr)
library(palmerpenguins)
## Every pair of measures in one panel: a self-join of the long table.
measures <- c(bill_length_mm = "Bill length", bill_depth_mm = "Bill depth",
flipper_length_mm = "Flipper length")
long <- penguins |>
filter(if_all(all_of(names(measures)), \(x) !is.na(x))) |>
mutate(bird = row_number()) |>
pivot_longer(all_of(names(measures)), names_to = "measure", values_to = "value") |>
mutate(measure = factor(measures[measure], levels = measures))
pairs <- inner_join(long, long, by = c("bird", "species"), suffix = c("_x", "_y"),
relationship = "many-to-many") |>
filter(measure_x != measure_y)
## Species named in one panel, next to their cloud.
names_at <- tibble(species = c("Adelie", "Chinstrap", "Gentoo"), value_x = c(34, 55, 55),
value_y = c(21, 21, 14), measure_x = factor("Bill length", levels = measures),
measure_y = factor("Bill depth", levels = measures))
p <- ggplot(pairs, aes(x = value_x, y = value_y, colour = species)) +
geom_point(size = 0.4, alpha = 0.6) +
geom_text(data = names_at, aes(label = species), size = 2.6) +
facet_grid(measure_y ~ measure_x, scales = "free", switch = "both") +
labs(title = "Within each species, the three measures rise together",
subtitle = "Every pair of measures (mm), one point per penguin",
x = NULL, y = NULL,
caption = "Data: palmerpenguins (Horst, Hill & Gorman 2020)") +
theme_lex_viz(base_size = 8, grid = "", arrows = "") +
theme(legend.position = "none", axis.text = element_blank(),
panel.border = element_rect(colour = "#d6d6d6", fill = NA, linewidth = 0.3),
strip.placement = "outside")Sources (22)
185 occurrences in the corpus; indexed by 4 books
Show the 22 sources
- Applied Multivariate Statistics in R
- Computational statistics in data science
- Cook & Laa, Interactively Exploring High-Dimensional Data and Models in R, Chapman & Hall/CRC, 2026
- Data visualization handbook
- Data visualization: a practical introduction
- Envisioning information
- Exploratory Data Analysis: Descriptive Analysis, Visualization, and Dashboard Design (w...
- Friendly & Wainer, A History of Data Visualization and Graphic Communication, Harvard University Press, 2021
- Fundamentals of computer graphics
- How maps work: representation, visualization, and design
- Interactive data visualization: foundations, techniques, and applications
- LibreTexts Statistics, textbook chapters on charts
- Milestones in the history of thematic cartography, statistical graphics, and data visua...
- Progressive Data Analysis: Roadmap and Research Agenda
- The elements of graphing data
- The golden age of data visualization: how did we get here?
- The grammar of graphics
- Thematic Cartography and Geovisualization
- Visualization Analysis and Design
- Visualize This
- Wickham, Navarro & Pedersen, ggplot2: Elegant Graphics for Data Analysis, 3rd ed. online↗
- Wilke, Fundamentals of Data Visualization, O'Reilly, 2019
Cite this entry
Stable addresshttps://dataviz.adrientaudiere.com/en-only/term/scatterplot-matrix.html
ReferenceTaudière Adrien. 2026. scatterplot matrix. In Visualization Vocabulary, version 1.0.0. IdEst. https://dataviz.adrientaudiere.com/en-only/term/scatterplot-matrix.html
BibTeX
@incollection{taudiere2026-scatterplot-matrix,
  author    = {Taudière, Adrien},
  title     = {scatterplot matrix},
  booktitle = {Visualization Vocabulary},
  year      = {2026},
  version   = {1.0.0},
  publisher = {IdEst},
  url       = {https://dataviz.adrientaudiere.com/en-only/term/scatterplot-matrix.html},
  note      = {CC0 1.0}
}Page created on 2026-10-13. Text last changed on 2026-11-10. Images last changed on 2026-11-02. Numbers computed on 2026-10-22.