
 chart
sparkline
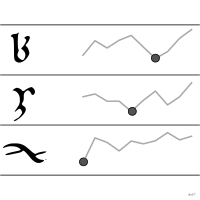
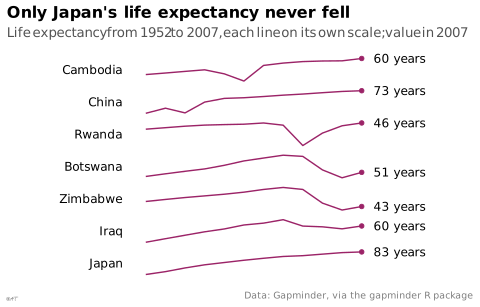
Small axis-free chart embedded in running text.
Classification
- chart
- lines and areas › lines
- change over time
Channels
 position on common scale; main: value (no axis)
Scientific literature
OpenAlex: 201 papers since 2006, 28% in the last five years; mostly in Computer Science, Mathematics, Business, Management and Accounting; Wikidata
Seminal references
- formalization (2006) Tufte (2006). Beautiful Evidence. Graphics Press; Friendly & Denis 2001, Ciuccarelli 2026
R packages
- R
gtExtras::gt_plt_sparkline(); GitHub 223 stars; last commit 2026-01 - R
ggspark::stat_sparklabels(); GitHub 13 stars; last commit 2024-05; paper (0 citations) - R
sparkline::sparkline()
R code of the ggplot2 example
library(ggplot2)
library(dplyr)
library(gapminder)
shown <- c("Cambodia", "China", "Rwanda", "Botswana", "Zimbabwe", "Iraq", "Japan")
## Each line on its own scale, in a band of height 0.7 on its own row.
lines <- gapminder |>
filter(country %in% shown) |>
mutate(row = match(country, rev(shown))) |>
group_by(country) |>
mutate(y = row + 0.7 * (lifeExp - min(lifeExp)) / (max(lifeExp) - min(lifeExp))) |>
ungroup()
last <- lines |>
filter(year == 2007)
p <- ggplot(lines, aes(x = year, y = y, group = country)) +
geom_line(linewidth = 0.5, colour = "#9b2367") +
geom_point(data = last, size = 1.3, colour = "#9b2367") +
geom_text(data = last, aes(x = 1946, y = row + 0.35, label = country), hjust = 1, size = 3.2) +
geom_text(data = last, aes(x = 2010, label = paste(round(lifeExp), "years")), hjust = 0, size = 3.2) +
scale_x_continuous(limits = c(1922, 2030)) +
labs(title = "Only Japan's life expectancy never fell",
subtitle = "Life expectancy from 1952 to 2007, each line on its own scale; value in 2007",
x = NULL, y = NULL,
caption = "Data: Gapminder, via the gapminder R package") +
theme_lex_viz(grid = "", arrows = "") +
theme(axis.text = element_blank())Sources (20)
72 occurrences in the corpus; indexed by 8 books
Show the 20 sources
- Atlas of knowledge: anyone can map
- Beautiful evidence
- Better data visualizations: a guide for scholars, researchers, and wonks
- Data visualization handbook
- Data Viz Project
- datavizproject.com
- datawrapper.de↗
- Effective data visualization: the right chart for the right data
- Making and Breaking the Grid, Third Edition
- Milestones in the history of thematic cartography, statistical graphics, and data visua...
- Open Visualization Academy, courses and newsletter (Cairo et al.)
- Seeing with fresh eyes: meaning, space, data, truth
- The big book of dashboards: visualizing your data using real-world business scenarios
- The book of trees: visualizing branches of knowledge
- Tufte, Beautiful Evidence, 2006
- Visualization Analysis and Design
- Visualization of Time-Oriented Data
- Visualizing with text
- Wikipedia — Data and information visualization
- Wikipedia in English↗
Cite this entry
Stable addresshttps://dataviz.adrientaudiere.com/en-only/term/sparkline.html
ReferenceTaudière Adrien. 2026. sparkline. In Visualization Vocabulary, version 1.0.0. IdEst. https://dataviz.adrientaudiere.com/en-only/term/sparkline.html
BibTeX
@incollection{taudiere2026-sparkline,
  author    = {Taudière, Adrien},
  title     = {sparkline},
  booktitle = {Visualization Vocabulary},
  year      = {2026},
  version   = {1.0.0},
  publisher = {IdEst},
  url       = {https://dataviz.adrientaudiere.com/en-only/term/sparkline.html},
  note      = {CC0 1.0}
}Page created on 2026-10-13. Text last changed on 2026-11-12. Images last changed on 2026-11-12. Numbers computed on 2026-10-22.