
 chart
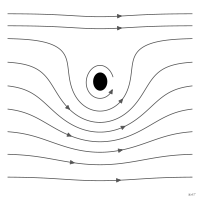
streamline plot
also: streamlinesCurves tangent at every point to the direction of a vector field, such as a wind or a current.
Classification
- chart
- flows
- flow
- the name evokes: nature
Channels
 position on common scale; main: position in the field
 tilt/angle; main: flow direction
Attestation
- English definition: Munzner, Visualization Analysis and Design, 2014
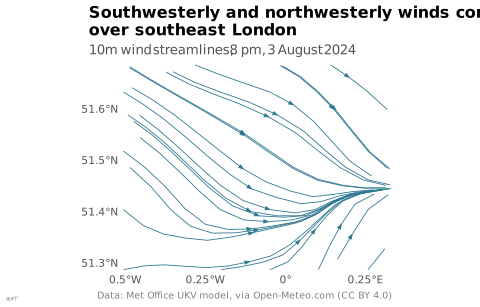
R code of the ggplot2 example
library(ggplot2)
library(metR)
## 10 m wind over London on 3 August 2024 at 8 pm (Met Office UKV model,
## 2 km), 12 x 8 points. The model cells are not quite aligned: each point
## is placed on a regular grid by its rank in longitude and in latitude.
lon <- c(-0.507, -0.432, -0.359, -0.276, -0.204, -0.128, -0.049, 0.027, 0.103, 0.182, 0.258, 0.334)
lat <- c(51.287, 51.344, 51.404, 51.461, 51.518, 51.576, 51.633, 51.693)
## Speed (km/h) and direction the wind blows from (degrees), row by row from
## the south, west to east within each row.
speed <- c(10.8, 8.6, 10.4, 9.4, 10.1, 10.1, 10.4, 8.6, 11.5, 12.6, 11.9, 10.8,
8.6, 9.4, 10.1, 10.4, 11.5, 10.4, 10.1, 11.5, 10.1, 14, 14, 14.4,
13.7, 14, 13.7, 13.7, 12.6, 13.7, 13, 11.5, 8.3, 10.4, 14.4, 15.1,
14, 13.7, 13.7, 12.6, 13.3, 12.2, 11.2, 13, 12.2, 12.2, 11.9, 10.4,
11.2, 11.5, 11.9, 13.7, 13.7, 14, 13.7, 13.7, 13.7, 13, 13, 13,
9.4, 10.1, 13.7, 13.3, 14, 14.4, 15.8, 13.7, 11.5, 12.2, 14, 13.7,
10.8, 10.8, 12.2, 11.9, 13.3, 14.4, 13.3, 10.4, 11.5, 11.2, 11.2, 11.9,
10.4, 10.4, 10.4, 11.2, 10.4, 9.4, 8.3, 9.7, 10.1, 9.7, 11.2, 10.4)
from <- c(257, 261, 275, 274, 265, 259, 265, 214, 204, 216, 221, 228,
278, 274, 271, 276, 259, 247, 240, 231, 201, 209, 211, 215,
314, 321, 324, 315, 308, 294, 280, 280, 240, 212, 215, 221,
312, 314, 313, 315, 309, 304, 289, 301, 284, 290, 295, 285,
302, 308, 314, 312, 309, 308, 307, 307, 311, 321, 320, 319,
300, 308, 309, 307, 300, 298, 298, 301, 320, 323, 320, 317,
302, 300, 300, 293, 288, 287, 290, 310, 316, 308, 310, 308,
300, 303, 299, 292, 292, 294, 296, 298, 300, 301, 307, 311)
wind <- expand.grid(lon = lon, lat = lat)
## A wind from `from` degrees blows towards the opposite direction; m/s,
## then degrees of longitude and latitude per second for the integration.
wind$u <- -speed / 3.6 * sin(from * pi / 180)
wind$v <- -speed / 3.6 * cos(from * pi / 180)
wind$dx <- dlon(wind$u, wind$lat)
wind$dy <- dlat(wind$v)
p <- ggplot(wind, aes(x = lon, y = lat)) +
geom_streamline(aes(dx = dx, dy = dy), L = 2, res = 0.8, jitter = 0,
colour = lex_colors[["blue"]], linewidth = 0.3,
arrow.length = 0.25, arrow.angle = 20) +
scale_x_continuous(labels = \(x) paste0(abs(x), "°", ifelse(x < 0, "W", ifelse(x > 0, "E", ""))),
expand = expansion(0)) +
scale_y_continuous(labels = \(y) paste0(y, "°N"), expand = expansion(0)) +
coord_quickmap() +
labs(title = "Southwesterly and northwesterly winds converge\nover southeast London",
subtitle = "10 m wind streamlines, 8 pm, 3 August 2024",
x = NULL, y = NULL,
caption = "Data: Met Office UKV model, via Open-Meteo.com (CC BY 4.0)") +
theme_lex_viz(grid = "", arrows = "") +
theme(plot.title.position = "plot")Sources (11)
146 occurrences in the corpus; indexed by 3 books
Show the 11 sources
- Atlas of knowledge: anyone can map
- Better data visualizations: a guide for scholars, researchers, and wonks
- Building Science Graphics: An Illustrated Guide to Communicating Science through Diagra...
- Cartography: thematic map design
- Effective data visualization: the right chart for the right data
- Fundamentals of computer graphics
- Graphics for learning: proven guidelines for planning, designing, and evaluating visual...
- Information theory tools for visualization
- Interactive data visualization: foundations, techniques, and applications
- Munzner, Visualization Analysis and Design, 2014
- Visualization Analysis and Design
Cite this entry
Stable addresshttps://dataviz.adrientaudiere.com/en-only/term/streamline-plot.html
ReferenceTaudière Adrien. 2026. streamline plot. In Visualization Vocabulary, version 1.0.0. IdEst. https://dataviz.adrientaudiere.com/en-only/term/streamline-plot.html
BibTeX
@incollection{taudiere2026-streamline-plot,
  author    = {Taudière, Adrien},
  title     = {streamline plot},
  booktitle = {Visualization Vocabulary},
  year      = {2026},
  version   = {1.0.0},
  publisher = {IdEst},
  url       = {https://dataviz.adrientaudiere.com/en-only/term/streamline-plot.html},
  note      = {CC0 1.0}
}Page created on 2026-11-10. Text last changed on 2026-11-10. Images last changed on 2026-11-11. Numbers computed on 2026-10-22.