
 chart
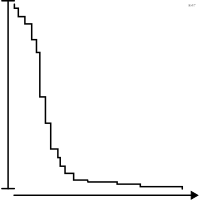
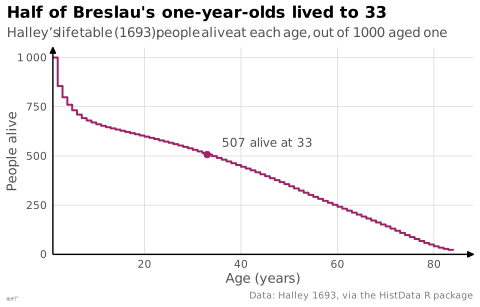
survival curve
also: Kaplan-Meier curveShare of subjects still event-free over time.
Classification
- chart
- lines and areas › statistical curves
- change over time
- the name evokes: eponym
Channels
 position on common scale; main: event-free proportion
 color hue; secondary: group
 shape; secondary: censored data (dashes)
Scientific literature
OpenAlex: 79 055 papers since 1923, 40% in the last five years; mostly in Medicine, Biochemistry, Genetics and Molecular Biology, Mathematics
Seminal references
- formalization (1958) Kaplan & Meier (1958). Nonparametric Estimation from Incomplete Observations. Journal of the American Statistical Association (46 049 citations)
R packages
- R
survminer::ggsurvplot(); GitHub 577 stars; last commit 2026-07
R code of the ggplot2 example
library(ggplot2)
library(HistData)
half <- HalleyLifeTable[HalleyLifeTable$age == 33, ]
p <- ggplot(HalleyLifeTable, aes(x = age, y = number)) +
geom_step(linewidth = 0.7, colour = "#9b2367") +
geom_point(data = half, size = 2, colour = "#9b2367") +
annotate("text", x = half$age + 3, y = half$number + 40, label = "507 alive at 33",
hjust = 0, vjust = 0, size = 3.2, colour = "#535353") +
scale_x_continuous(labels = lex_number, expand = expansion(mult = c(0, 0.05))) +
scale_y_continuous(labels = lex_number, expand = expansion(mult = c(0, 0.05)), limits = c(0, 1000)) +
labs(title = "Half of Breslau's one-year-olds lived to 33",
subtitle = "Halley's life table (1693): people alive at each age, out of 1\u2009000 aged one",
x = "Age (years)", y = "People alive",
caption = "Data: Halley 1693, via the HistData R package") +
theme_lex_viz()Sources (3)
2 occurrences in the corpus
Cite this entry
Stable addresshttps://dataviz.adrientaudiere.com/en-only/term/survival-curve.html
ReferenceTaudière Adrien. 2026. survival curve. In Visualization Vocabulary, version 1.0.0. IdEst. https://dataviz.adrientaudiere.com/en-only/term/survival-curve.html
BibTeX
@incollection{taudiere2026-survival-curve,
  author    = {Taudière, Adrien},
  title     = {survival curve},
  booktitle = {Visualization Vocabulary},
  year      = {2026},
  version   = {1.0.0},
  publisher = {IdEst},
  url       = {https://dataviz.adrientaudiere.com/en-only/term/survival-curve.html},
  note      = {CC0 1.0}
}Page created on 2026-10-13. Text last changed on 2026-10-22. Images last changed on 2026-11-02. Numbers computed on 2026-10-22.