
 chart
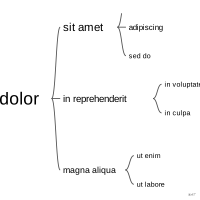
word tree
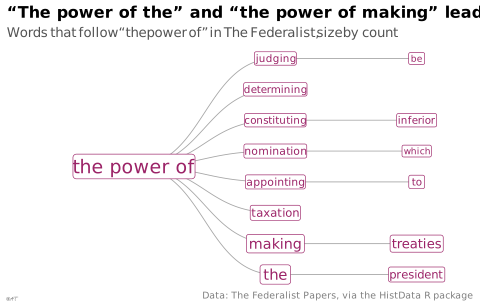
Branching of word sequences following a pivot term.
Classification
- chart
- networks and trees › hierarchical trees
- the name evokes: nature
Channels
 area; main: frequency (text size)
 spatial region; main: link between words
Scientific literature
OpenAlex: 279 papers since 1980, 37% in the last five years; mostly in Computer Science, Social Sciences, Arts and Humanities
Seminal references
R code of the ggplot2 example
library(ggplot2)
library(dplyr)
library(tidyr)
library(tidytext)
library(igraph)
library(ggraph)
library(HistData)
## What follows "the power of" in the 85 essays: the eight most frequent next
## words, then, for each, the next word when it occurs at least twice.
phrases <- Federalist_text |>
unnest_tokens(phrase, text, token = "ngrams", n = 5) |>
filter(startsWith(phrase, "the power of ")) |>
separate(phrase, c(NA, NA, NA, "w1", "w2"), sep = " ")
first <- phrases |>
count(w1, sort = TRUE) |>
slice_head(n = 8)
second <- phrases |>
filter(w1 %in% first$w1) |>
count(w1, w2) |>
filter(n >= 2) |>
group_by(w1) |>
slice_max(n, n = 1, with_ties = FALSE) |>
ungroup()
edges <- bind_rows(tibble(from = "the power of", to = first$w1),
tibble(from = second$w1, to = paste(second$w1, second$w2)))
nodes <- bind_rows(tibble(name = "the power of", label = "the power of", n = sum(first$n)),
tibble(name = first$w1, label = first$w1, n = first$n),
tibble(name = paste(second$w1, second$w2), label = second$w2, n = second$n))
tree <- graph_from_data_frame(edges, vertices = nodes)
p <- ggraph(tree, layout = "tree") +
geom_edge_diagonal(colour = "#a6a6a6", width = 0.3) +
geom_node_label(aes(label = label, size = n), family = "Quicksand", colour = "#9b2367",
label.size = 0, fill = "white") +
scale_size(range = c(2.4, 5)) +
coord_flip() +
scale_y_reverse(expand = expansion(mult = c(0.45, 0.2))) +
labs(title = "“The power of the” and “the power of making” lead",
subtitle = "Words that follow “the power of” in The Federalist, size by count",
caption = "Data: The Federalist Papers, via the HistData R package") +
theme_lex_viz(grid = "", arrows = "") +
theme(legend.position = "none", axis.text = element_blank(), axis.title = element_blank())Sources (8)
42 occurrences in the corpus; indexed by 3 books
- Better data visualizations: a guide for scholars, researchers, and wonks
- Bremer & Barone, Chart, CRC Press, 2025
- Design for information: an introduction to the histories, theories, and best practices ...
- Interactive data visualization: foundations, techniques, and applications
- Seeing with fresh eyes: meaning, space, data, truth
- The book of trees: visualizing branches of knowledge
- Visualization Analysis and Design
- Visualizing with text
Cite this entry
Stable addresshttps://dataviz.adrientaudiere.com/en-only/term/word-tree.html
ReferenceTaudière Adrien. 2026. word tree. In Visualization Vocabulary, version 1.0.0. IdEst. https://dataviz.adrientaudiere.com/en-only/term/word-tree.html
BibTeX
@incollection{taudiere2026-word-tree,
  author    = {Taudière, Adrien},
  title     = {word tree},
  booktitle = {Visualization Vocabulary},
  year      = {2026},
  version   = {1.0.0},
  publisher = {IdEst},
  url       = {https://dataviz.adrientaudiere.com/en-only/term/word-tree.html},
  note      = {CC0 1.0}
}Page created on 2026-10-13. Text last changed on 2026-11-02. Images last changed on 2026-11-09. Numbers computed on 2026-10-22.