


 chart
adjacency matrix
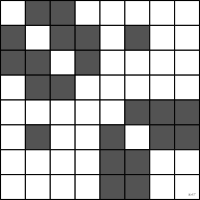
Square matrix encoding the presence of links between nodes.
matrice d'adjacence
Matrice carrée codant la présence de liens entre nœuds.
Classification
- chart
- matrices and tables › heat matrices
- flow
Channels
 color luminance; main: link weight; Munzner 2014
 color saturation; main: link weight (instead of luminance)
 spatial region; main: source and target node; Munzner 2014
 color hue; secondary: group; Munzner 2014
Attestation
- French term: French Wikipedia↗
- English definition: Data Visualisation Guide, data.europa.eu
Scientific literature
R code of the ggplot2 example
library(ggplot2)
library(dplyr)
library(igraph)
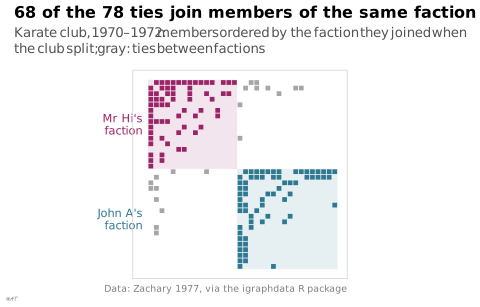
## Ties between the 34 members of a karate club: one row and one column per
## member, a square wherever two members met outside the club (each tie is
## drawn twice, the matrix is symmetric). Members are ordered by the faction
## they joined when the club split, which does not come from the ties.
data("karate", package = "igraphdata")
club <- upgrade_graph(karate)
members <- tibble(id = seq_len(vcount(club)),
faction = ifelse(V(club)$Faction == 1, "Mr Hi's faction", "John A's faction"),
degree = degree(club)) |>
arrange(faction != "Mr Hi's faction", desc(degree)) |>
mutate(position = row_number())
ends <- as_edgelist(club, names = FALSE)
ties <- tibble(a = c(ends[, 1], ends[, 2]), b = c(ends[, 2], ends[, 1])) |>
mutate(x = members$position[match(a, members$id)], y = members$position[match(b, members$id)],
fa = members$faction[match(a, members$id)], fb = members$faction[match(b, members$id)],
tie = ifelse(fa == fb, fa, "Between factions"))
blocks <- members |>
group_by(faction) |>
summarise(from = min(position) - 0.5, to = max(position) + 0.5)
p <- ggplot(ties, aes(x = x, y = y)) +
geom_rect(data = blocks, aes(xmin = from, xmax = to, ymin = from, ymax = to, fill = faction),
alpha = 0.12, inherit.aes = FALSE) +
geom_tile(aes(fill = tie), width = 0.85, height = 0.85) +
annotate("text", x = -0.5, y = (blocks$from + blocks$to) / 2, label = sub(" faction", "\nfaction", blocks$faction),
colour = unname(lex_colors[c("blue", "plum")]), hjust = 1, size = 3, lineheight = 0.9) +
scale_fill_manual(values = c(`Mr Hi's faction` = lex_colors[["plum"]],
`John A's faction` = lex_colors[["blue"]],
`Between factions` = "#a6a6a6")) +
scale_y_reverse() +
coord_fixed(clip = "off") +
labs(title = "68 of the 78 ties join members of the same faction",
subtitle = "Karate club, 1970–1972: members ordered by the faction they joined when the club split; gray: ties between factions",
caption = "Data: Zachary 1977, via the igraphdata R package") +
theme_lex_viz(grid = "", arrows = "") +
theme(legend.position = "none", axis.text = element_blank(), axis.title = element_blank(),
panel.border = element_rect(colour = "#d6d6d6", fill = NA, linewidth = 0.3))Sources (12)
42 occurrences in the corpus; indexed by 5 books
Show the 12 sources
- Atlas of knowledge: anyone can map
- Data Visualisation Guide, data.europa.eu
- Design for information: an introduction to the histories, theories, and best practices ...
- Exploratory Data Analysis: Descriptive Analysis, Visualization, and Dashboard Design (w...
- French Wikipedia↗
- Interactive data visualization: foundations, techniques, and applications
- The grammar of graphics
- Visual strategies for biological data
- Visualization Analysis and Design
- Visualization of Time-Oriented Data
- Visualizing with text
- Wikipedia in English↗
Cite this entry
Stable addresshttps://dataviz.adrientaudiere.com/en/term/adjacency-matrix.html
ReferenceTaudière Adrien. 2026. adjacency matrix. In Visualization Vocabulary, version 1.0.0. IdEst. https://dataviz.adrientaudiere.com/en/term/adjacency-matrix.html
BibTeX
@incollection{taudiere2026-adjacency-matrix,
  author    = {Taudière, Adrien},
  title     = {adjacency matrix},
  booktitle = {Visualization Vocabulary},
  year      = {2026},
  version   = {1.0.0},
  publisher = {IdEst},
  url       = {https://dataviz.adrientaudiere.com/en/term/adjacency-matrix.html},
  note      = {CC0 1.0}
}Page created on 2026-10-13. Text last changed on 2026-11-12. Images last changed on 2026-11-12. Numbers computed on 2026-10-22.