
 chart
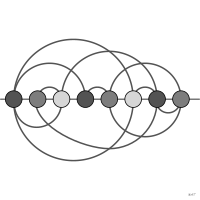
arc diagram
also: arc connectionNodes on a line joined by arcs.
diagramme en arc
Nœuds alignés reliés par des arcs.
Classification
- chart
- networks and trees › linear networks
- flow
Channels
 length; secondary: distance between nodes for each link
 spatial region; main: node order (on a line)
 color hue; secondary: group
Attestation
- French term: Lagnel, Manuel de datavisualisation, Dunod, 2021
- English definition: Data Visualisation Guide, data.europa.eu
Scientific literature
OpenAlex: 203 papers since 1988, 39% in the last five years; mostly in Mathematics, Computer Science, Engineering; Wikidata
Seminal references
- first known use (1964) Saaty (1964). The minimum number of intersections in complete graphs. Proceedings of the National Academy of Sciences (24 citations); Wikipedia in English
- first known use (1968) Nicholson (1968). Permutation procedure for minimising the number of crossings in a network. Proceedings of the Institution of Electrical Engineers (33 citations); Wikipedia in English
- naming (2002) Wattenberg (2002). Arc diagrams: visualizing structure in strings. IEEE Symposium on Information Visualization, 2002. INFOVIS 2002. (265 citations)
R packages
- R
ggraph::geom_edge_arc(); GitHub 1 121 stars; last commit 2025-08
R code of the ggplot2 example
library(ggplot2)
library(dplyr)
library(igraph)
library(ggraph)
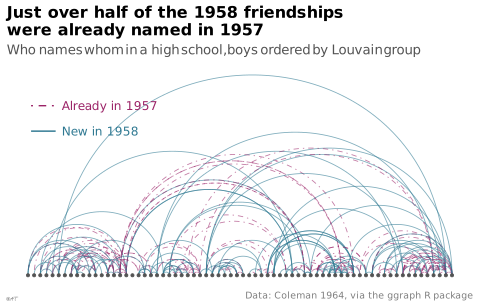
## Friendships named in 1958, marked by whether the same boy named the same
## friend in 1957. Boys ordered by the groups the Louvain method finds.
boys <- sort(unique(c(highschool$from, highschool$to)))
in_1957 <- with(filter(highschool, year == 1957), paste(from, to))
ties <- highschool |>
filter(year == 1958) |>
mutate(since = ifelse(paste(from, to) %in% in_1957, "Already in 1957", "New in 1958")) |>
select(from, to, since)
named <- graph_from_data_frame(ties, vertices = data.frame(name = boys))
set.seed(1)
V(named)$group <- as.integer(membership(cluster_louvain(as_undirected(named, mode = "collapse"))))
p <- ggraph(named, layout = "linear", sort.by = group) +
geom_edge_arc(aes(edge_colour = since, edge_linetype = since), fold = TRUE, edge_width = 0.3,
edge_alpha = 0.6) +
geom_node_point(size = 0.8, colour = "#535353") +
## The line type tells the two kinds apart without the colours.
annotate("segment", x = 1, xend = 5, y = c(20, 17), yend = c(20, 17),
colour = c("#9b2367", "#2e7891"), linetype = c("dotdash", "solid"), linewidth = 0.5) +
annotate("text", x = 6, y = 20, label = "Already in 1957", colour = "#9b2367", hjust = 0, size = 3.2) +
annotate("text", x = 6, y = 17, label = "New in 1958", colour = "#2e7891", hjust = 0, size = 3.2) +
scale_edge_colour_manual(values = c(`Already in 1957` = "#9b2367", `New in 1958` = "#2e7891")) +
scale_edge_linetype_manual(values = c(`Already in 1957` = "dotdash", `New in 1958` = "solid")) +
labs(title = "Just over half of the 1958 friendships\nwere already named in 1957",
subtitle = "Who names whom in a high school, boys ordered by Louvain group",
caption = "Data: Coleman 1964, via the ggraph R package") +
theme_lex_viz(grid = "", arrows = "") +
theme(legend.position = "none", axis.text = element_blank(), axis.title = element_blank())Sources (17)
24 occurrences in the corpus; indexed by 2 books
Show the 17 sources
- app.flourish.studio
- Atlas of knowledge: anyone can map
- Data Visualisation Guide, data.europa.eu
- Data visualisation: a handbook for data driven design
- Data Viz Project
- data-to-viz.com
- datavizcatalogue.com
- datavizproject.com
- From data to viz
- Interactive data visualization: foundations, techniques, and applications
- Lagnel, Manuel de datavisualisation, Dunod, 2021
- Les fondamentaux de la visualisation de données
- Manuel de datavisualisation - 2e éd, vol. 2
- python-graph-gallery.com
- The art of insight: how great visualization designers think
- Visual complexity: mapping patterns of information
- Wikipedia in English↗
Cite this entry
Stable addresshttps://dataviz.adrientaudiere.com/en/term/arc-diagram.html
ReferenceTaudière Adrien. 2026. arc diagram. In Visualization Vocabulary, version 1.0.0. IdEst. https://dataviz.adrientaudiere.com/en/term/arc-diagram.html
BibTeX
@incollection{taudiere2026-arc-diagram,
  author    = {Taudière, Adrien},
  title     = {arc diagram},
  booktitle = {Visualization Vocabulary},
  year      = {2026},
  version   = {1.0.0},
  publisher = {IdEst},
  url       = {https://dataviz.adrientaudiere.com/en/term/arc-diagram.html},
  note      = {CC0 1.0}
}Page created on 2026-10-13. Text last changed on 2026-11-02. Images last changed on 2026-11-12. Numbers computed on 2026-10-22.