
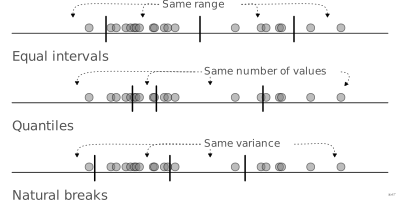
 encoding
bin
Interval of grouped values.
classe
aussi : intervalleIntervalle de valeurs regroupées.
Classification
- encoding
Attestation
- French term: Bertin, Sémiologie graphique, 1967
- English definition: ggplot2 reference
Sources (46)
124 occurrences in the corpus; indexed by 4 books
Show the 46 sources
- Audric, de Bellefon & Durieux, « Analyse spatiale descriptive », Manuel d'analyse spatiale (Insee Méthodes n° 131), 2018
- Ault, Nam Liao & Musolino, Principles of Data Science, OpenStax, 2025
- Barnier, Introduction à R et au tidyverse
- Bertin, Sémiologie graphique, 1967
- Better data visualizations: a guide for scholars, researchers, and wonks
- Ciccione, Sablé-Meyer & Dehaene, Analyzing the Misperception of Exponential Growth in Graphs, Cognition, 2022↗
- Computational statistics in data science
- Cook & Laa, Interactively Exploring High-Dimensional Data and Models in R, Chapman & Hall/CRC, 2026
- Data Visualisation Guide, data.europa.eu
- Data visualization: a practical introduction
- data-to-viz.com
- dataphys.org
- Dehaene, “The Perception of Graphics: A New Instance of Neuronal Recycling”, lecture course at the Collège de France, 2025 (in French)↗
- French Wikipedia — Visualisation de données
- From data to viz
- ggplot2 reference
- Giraud & Pecout, Géomatique et cartographie avec R
- Graphiques : vocabulaire, EBSI Montreal (after the GDT)↗
- Grosjean & Engels, Science des données biologiques I-III (University of Mons)
- Information graphics
- Insee, Guide de sémiologie graphique, édition 2017↗
- L’Atlas Molière
- La graphique et le traitement graphique de l'information
- Larmarange et al., analyse-R: introduction to survey analysis with R
- Larmarange, guide-R: analysing survey data with R
- Les fondamentaux de la visualisation de données
- LibreTexts Statistics, textbook chapters on charts
- Magrit user manual, French version (UAR RIATE, CNRS)
- Manuel de datavisualisation - 2e éd, vol. 2
- Open Visualization Academy, courses and newsletter (Cairo et al.)
- PBIL biostatistics notes (Chessel, Dufour, Thioulouse et al., Lyon 1)
- QCBS R Workshop Series, French version (Quebec Centre for Biodiversity Science)
- Rakotomalala, statistics course notes (Université Lyon 2)
- RGAA, French accessibility framework: glossary, criteria and tests
- Semiologie graphique: les diagrammes, les réseaux, les cartes.
- Semiology of graphics: diagrams, networks, maps
- StatsLearn, “Graphs and displays” glossary↗
- The Minard System: The Complete Statistical Graphics of Charles-Joseph Minard
- Thematic Cartography and Geovisualization
- utilitR, collaborative R documentation (Insee)
- Visualization Analysis and Design
- Wickham, Çetinkaya-Rundel & Grolemund, R for Data Science, 2nd ed., 2023
- Wickham, Navarro & Pedersen, ggplot2: Elegant Graphics for Data Analysis, 3rd ed. online↗
- Wikipedia — Data and information visualization
- Wikipedia in English↗
- Wilke, Fundamentals of Data Visualization, O'Reilly, 2019
Cite this entry
Stable addresshttps://dataviz.adrientaudiere.com/en/term/bin.html
ReferenceTaudière Adrien. 2026. bin. In Visualization Vocabulary, version 1.0.0. IdEst. https://dataviz.adrientaudiere.com/en/term/bin.html
BibTeX
@incollection{taudiere2026-bin,
  author    = {Taudière, Adrien},
  title     = {bin},
  booktitle = {Visualization Vocabulary},
  year      = {2026},
  version   = {1.0.0},
  publisher = {IdEst},
  url       = {https://dataviz.adrientaudiere.com/en/term/bin.html},
  note      = {CC0 1.0}
}Page created on 2026-10-13. Text last changed on 2026-10-14. Images last changed on 2026-10-13. Numbers computed on 2026-10-22.