

 chart
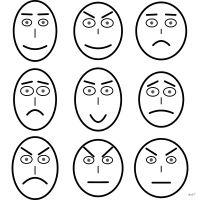
Chernoff faces
Multivariate display in which each variable drives one feature of a drawn human face.
figures de Chernoff
Représentation de données multivariées où chaque variable règle un trait d'un visage dessiné.
Indexé tel quel par Tufte (VDQI) ; sous « faces » seulement par Wilkinson, Cairo (The Functional Art) et Milestones. Chernoff 1973. Terme français et définitions d'après Wikipédia (« Figures de Chernoff », « Chernoff face »).
Classification
- chart
- glyphs
- the name evokes: nature, eponym
Channels
 length; main: value of a variable (nose size, eye spacing)
 tilt/angle; secondary: value of a variable (eyebrow slant)
 curvature; main: value of a variable (mouth curvature)
 shape; main: value of a variable (shape of the face and eyes)
Attestation
- French term: French Wikipedia↗
- English definition: Wikipedia in English↗
Scientific literature
OpenAlex: 176 papers since 1978, 18% in the last five years; mostly in Computer Science, Social Sciences, Mathematics; Wikidata
R packages
- R
aplpack::faces(); paper (1 375 citations) DOI de la méthode (Chernoff 1973), le paquet n'en a pas.
R code of the ggplot2 example
library(ggplot2)
library(dplyr)
library(gapminder)
library(ggChernoff)
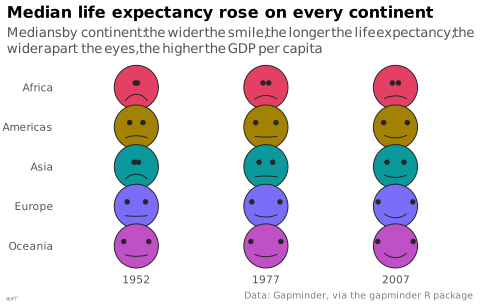
## One face per continent and year: the smile codes the median life
## expectancy, the space between the eyes the median GDP per capita.
faces <- gapminder |>
filter(year %in% c(1952, 1977, 2007)) |>
group_by(continent, year) |>
summarise(life = median(lifeExp), gdp = log10(median(gdpPercap)), .groups = "drop")
p <- ggplot(faces, aes(x = factor(year), y = continent, smile = life, eyes = gdp, fill = continent)) +
geom_chernoff(size = 24, colour = "#262626") +
scale_fill_manual(values = continent_colors, guide = "none") +
scale_y_discrete(limits = rev) +
scale_smile_continuous(range = c(-1, 1), guide = "none") +
scale_eyes_continuous(guide = "none") +
labs(title = "Median life expectancy rose on every continent",
subtitle = "Medians by continent: the wider the smile, the longer the life expectancy; the wider apart the eyes, the higher the GDP per capita",
x = NULL, y = NULL,
caption = "Data: Gapminder, via the gapminder R package") +
theme_lex_viz(grid = "", arrows = "")Sources (14)
27 occurrences in the corpus; indexed by 2 books
Show the 14 sources
- Atlas of knowledge: anyone can map
- Cartography: thematic map design
- Data visualization handbook
- Data Viz Project
- datavizproject.com
- French Wikipedia↗
- French Wikipedia — Visualisation de données
- Information Graphics: A Comprehensive Illustrated Reference
- Milestones in the history of thematic cartography, statistical graphics, and data visua...
- The elements of graphing data
- The grammar of graphics
- The visual display of quantitative information
- Thematic Cartography and Geovisualization
- Wikipedia in English↗
Cite this entry
Stable addresshttps://dataviz.adrientaudiere.com/en/term/chernoff-faces.html
ReferenceTaudière Adrien. 2026. Chernoff faces. In Visualization Vocabulary, version 1.0.0. IdEst. https://dataviz.adrientaudiere.com/en/term/chernoff-faces.html
BibTeX
@incollection{taudiere2026-chernoff-faces,
  author    = {Taudière, Adrien},
  title     = {Chernoff faces},
  booktitle = {Visualization Vocabulary},
  year      = {2026},
  version   = {1.0.0},
  publisher = {IdEst},
  url       = {https://dataviz.adrientaudiere.com/en/term/chernoff-faces.html},
  note      = {CC0 1.0}
}Page created on 2026-10-13. Text last changed on 2026-11-12. Images last changed on 2026-11-09. Numbers computed on 2026-10-22.