
 chart
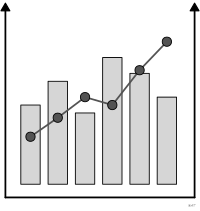
combination chart
also: combo chart, column + line timelineTwo mark types overlaid in the same coordinate system.
graphique combiné
aussi : graphique mixteSuperposition de deux types de marques dans un même repère.
Classification
- chart
- composites
- correlation, change over time; Financial Times Visual Vocabulary
Channels
 position on common scale; main: first series
 position on unaligned scale; main: second series (secondary axis, own scale)
 spatial region; main: category on the x axis
Attestation
- French term: Common usage, not attested by a source
- English definition: Financial Times Visual Vocabulary
Scientific literature
OpenAlex: 62 papers since 1996, 27% in the last five years; mostly in Computer Science, Decision Sciences, Medicine
Seminal references
R packages
- R
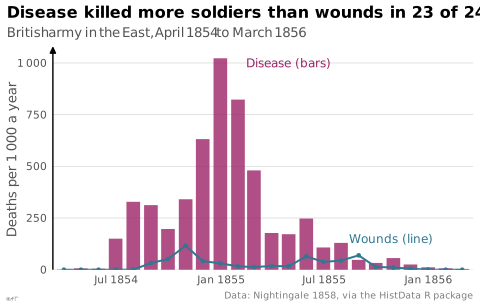
ggplot2::sec_axis(); tutorial; GitHub 7 025 stars; last commit 2026-10; paper (33 455 citations) Second axe ; les deux marques se superposent en calques, par exemple geom_col et geom_line.
R code of the ggplot2 example
library(ggplot2)
library(HistData)
## Bars and a line share one axis: annual death rates per 1 000 soldiers.
p <- ggplot(Nightingale, aes(x = Date)) +
geom_col(aes(y = Disease.rate), fill = "#9b2367", alpha = 0.8, width = 24) +
geom_line(aes(y = Wounds.rate), colour = "#2e7891", linewidth = 0.7) +
geom_point(aes(y = Wounds.rate), colour = "#2e7891", size = 1) +
annotate("text", x = as.Date("1855-02-15"), y = 1000, label = "Disease (bars)",
colour = "#9b2367", hjust = 0, size = 3.2) +
annotate("text", x = as.Date("1855-08-15"), y = 150, label = "Wounds (line)",
colour = "#2e7891", hjust = 0, size = 3.2) +
scale_x_date(breaks = as.Date(c("1854-07-01", "1855-01-01", "1855-07-01", "1856-01-01")),
labels = scales::label_date("%b %Y", locale = "en"), expand = expansion(mult = 0.01)) +
scale_y_continuous(labels = lex_number, expand = expansion(mult = c(0, 0.05))) +
labs(title = "Disease killed more soldiers than wounds in 23 of 24 months",
subtitle = "British army in the East, April 1854 to March 1856",
x = NULL, y = "Deaths per 1 000 a year",
caption = "Data: Nightingale 1858, via the HistData R package") +
theme_lex_viz(grid = "y", arrows = "y")Sources (6)
16 occurrences in the corpus; indexed by 3 books
- Data visualization handbook
- Effective data visualization: the right chart for the right data
- Financial Times Visual Vocabulary
- Information Graphics: A Comprehensive Illustrated Reference
- Practical charts: the essential guide to creating clear, compelling charts for reports ...
- The big book of dashboards: visualizing your data using real-world business scenarios
Cite this entry
Stable addresshttps://dataviz.adrientaudiere.com/en/term/combo-chart.html
ReferenceTaudière Adrien. 2026. combination chart. In Visualization Vocabulary, version 1.0.0. IdEst. https://dataviz.adrientaudiere.com/en/term/combo-chart.html
BibTeX
@incollection{taudiere2026-combo-chart,
  author    = {Taudière, Adrien},
  title     = {combination chart},
  booktitle = {Visualization Vocabulary},
  year      = {2026},
  version   = {1.0.0},
  publisher = {IdEst},
  url       = {https://dataviz.adrientaudiere.com/en/term/combo-chart.html},
  note      = {CC0 1.0}
}Page created on 2026-10-13. Text last changed on 2026-11-10. Images last changed on 2026-11-09. Numbers computed on 2026-10-22.