
 chart
corrgram
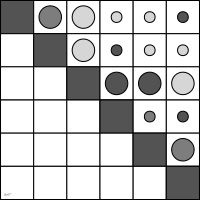
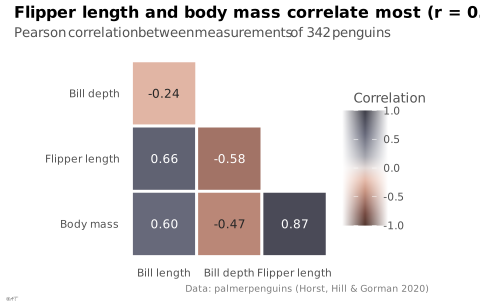
also: correlation matrix plotColored matrix of correlation coefficients between every pair of variables.
corrélogramme
Matrice colorée des coefficients de corrélation entre toutes les paires de variables.
Faux-ami : en anglais correlogram désigne d'abord l'autocorrélation en fonction du décalage (voir autocorrélogramme). Wilke appelle pourtant correlogram cette matrice ; corrgram est le nom de Friendly (2002).
Classification
- chart
- matrices and tables › heat matrices
- correlation
Channels
 tilt/angle; secondary: sign (ellipse variant)
 area; secondary: strength of the correlation (circle variant)
 color luminance; main: strength of the correlation
 color saturation; main: strength of the correlation (instead of luminance)
 spatial region; main: pair of variables
 color hue; main: sign of the correlation
Attestation and synonyms
Scientific literature
OpenAlex: 36 papers since 2018, 47% in the last five years; mostly in Medicine, Social Sciences, Agricultural and Biological Sciences
Seminal references
- invention (2002) Friendly (2002). Corrgrams: exploratory displays for correlation matrices. The American Statistician (698 citations)
R packages
- R
corrplot::corrplot(); GitHub 347 stars; last commit 2024-10 - R
corrgram::corrgram(); GitHub 18 stars; last commit 2026-09; paper (688 citations) DOI de la méthode (Friendly 2002), que le paquet implémente.
R code of the ggplot2 example
library(ggplot2)
library(dplyr)
library(palmerpenguins)
## Pearson correlation of each pair of measurements, lower triangle only:
## the matrix is symmetric and its diagonal is always 1.
measures <- c(`Bill length` = "bill_length_mm", `Bill depth` = "bill_depth_mm",
`Flipper length` = "flipper_length_mm", `Body mass` = "body_mass_g")
r <- cor(na.omit(penguins[, measures]))
dimnames(r) <- list(names(measures), names(measures))
pairs <- as.data.frame(as.table(r)) |>
setNames(c("row", "column", "r")) |>
filter(as.integer(row) > as.integer(column)) |>
mutate(row = factor(row, levels = rev(names(measures))))
p <- ggplot(pairs, aes(x = column, y = row, fill = r)) +
geom_tile(colour = "white", linewidth = 1) +
geom_text(aes(label = sprintf("%.2f", r), colour = abs(r) > 0.5), size = 3.2) +
scale_fill_gradientn(colours = idest_div, limits = c(-1, 1), name = "Correlation") +
scale_colour_manual(values = c(`TRUE` = "white", `FALSE` = "#262626"), guide = "none") +
coord_equal() +
labs(title = "Flipper length and body mass correlate most (r = 0.87)",
subtitle = "Pearson correlation between measurements of 342 penguins",
x = NULL, y = NULL,
caption = "Data: palmerpenguins (Horst, Hill & Gorman 2020)") +
theme_lex_viz(grid = "", arrows = "") +
theme(legend.position = "right")Sources (5)
Cite this entry
Stable addresshttps://dataviz.adrientaudiere.com/en/term/corrgram.html
ReferenceTaudière Adrien. 2026. corrgram. In Visualization Vocabulary, version 1.0.0. IdEst. https://dataviz.adrientaudiere.com/en/term/corrgram.html
BibTeX
@incollection{taudiere2026-corrgram,
  author    = {Taudière, Adrien},
  title     = {corrgram},
  booktitle = {Visualization Vocabulary},
  year      = {2026},
  version   = {1.0.0},
  publisher = {IdEst},
  url       = {https://dataviz.adrientaudiere.com/en/term/corrgram.html},
  note      = {CC0 1.0}
}Page created on 2026-10-13. Text last changed on 2026-11-02. Images last changed on 2026-11-11. Numbers computed on 2026-10-22.