
 chart
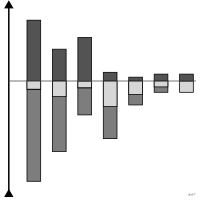
diverging stacked bar chart
also: bilateral bar chart, two-way bar chartStacked bars whose segments extend either side of a baseline.
barres empilées divergentes
Barres empilées dont les segments s'étendent de part et d'autre d'une ligne de base.
Le graphique de Likert (likert-chart) en est le cas particulier le plus courant.
Classification
- chart
- bars › diverging bars
- deviation; Financial Times Visual Vocabulary
Channels
 position on common scale; main: cumulative values (segments without a common baseline, except around the neutral point)
 position on unaligned scale; secondary: value (segments without a common baseline, except around the neutral point)
 length; main: value
 color saturation; secondary: ordered series (instead of hue if the category is ordered)
 spatial region; main: sign
 color hue; secondary: series (if the category is ordered, luminance or saturation can also be used)
Variants
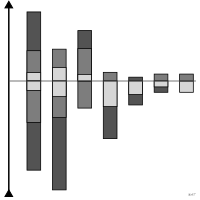 Likert chartspecial case
Attestation and synonyms
- French term: Common usage, not attested by a source
- barre empilée divergente; Financial Times Visual Vocabulary, French version↗
- bilateral bar chart; Brinton, Graphic Presentation, 1939↗
- two-way bar chart; Brinton, Graphic Presentation, 1939↗
Scientific literature
OpenAlex: 13 papers since 2017, 31% in the last five years; mostly in Computer Science, Social Sciences, Agricultural and Biological Sciences
Seminal references
- first known use (1939) Brinton (1939). Graphic Presentation. Brinton Associates; Brinton 1939
R packages
- R
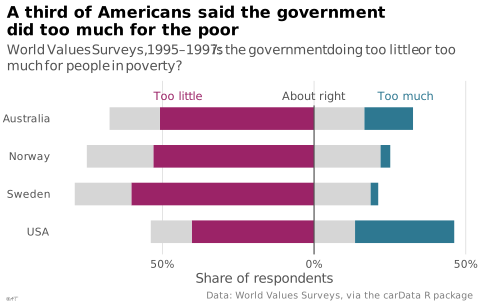
ggplot2::geom_col(); GitHub 7 025 stars; last commit 2026-10; paper (33 455 citations) Barres empilées divergentes autour du point neutre.
R code of the ggplot2 example
library(ggplot2)
library(dplyr)
library(carData)
## "Is the government doing too little, about right or too much for people
## in poverty?": "too little" to the left, "too much" to the right, "about
## right" split across zero.
answers <- WVS |>
count(country, poverty) |>
group_by(country) |>
mutate(share = 100 * n / sum(n)) |>
ungroup()
left <- answers |>
filter(poverty != "Too Much") |>
mutate(share = -ifelse(poverty == "About Right", share / 2, share),
poverty = factor(poverty, levels = c("About Right", "Too Little")))
right <- answers |>
filter(poverty != "Too Little") |>
mutate(share = ifelse(poverty == "About Right", share / 2, share),
poverty = factor(poverty, levels = c("Too Much", "About Right")))
colours <- c(`Too Little` = "#9b2367", `About Right` = "#d6d6d6", `Too Much` = "#2e7891")
p <- ggplot(mapping = aes(x = share, y = country, fill = poverty)) +
geom_col(data = left, width = 0.6) +
geom_col(data = right, width = 0.6) +
## Stops below the column labels.
annotate("segment", x = 0, xend = 0, y = 0.4, yend = 4.35, colour = "#535353", linewidth = 0.4) +
annotate("text", x = c(-45, 0, 30), y = 4.6, label = c("Too little", "About right", "Too much"),
colour = c("#9b2367", "#535353", "#2e7891"), size = 3) +
scale_fill_manual(values = colours) +
scale_y_discrete(limits = rev, expand = expansion(add = c(0.6, 1))) +
scale_x_continuous(labels = \(x) paste0(lex_number(abs(x)), "%")) +
labs(title = "A third of Americans said the government\ndid too much for the poor",
subtitle = "World Values Surveys, 1995–1997: is the government doing too little or too much for people in poverty?",
x = "Share of respondents", y = NULL,
caption = "Data: World Values Surveys, via the carData R package") +
theme_lex_viz(grid = "x", arrows = "") +
theme(legend.position = "none")Sources (4)
9 occurrences in the corpus
Cite this entry
Stable addresshttps://dataviz.adrientaudiere.com/en/term/diverging-stacked-bar-chart.html
ReferenceTaudière Adrien. 2026. diverging stacked bar chart. In Visualization Vocabulary, version 1.0.0. IdEst. https://dataviz.adrientaudiere.com/en/term/diverging-stacked-bar-chart.html
BibTeX
@incollection{taudiere2026-diverging-stacked-bar-chart,
  author    = {Taudière, Adrien},
  title     = {diverging stacked bar chart},
  booktitle = {Visualization Vocabulary},
  year      = {2026},
  version   = {1.0.0},
  publisher = {IdEst},
  url       = {https://dataviz.adrientaudiere.com/en/term/diverging-stacked-bar-chart.html},
  note      = {CC0 1.0}
}Page created on 2026-10-13. Text last changed on 2026-11-02. Images last changed on 2026-11-12. Numbers computed on 2026-10-22.