
 process
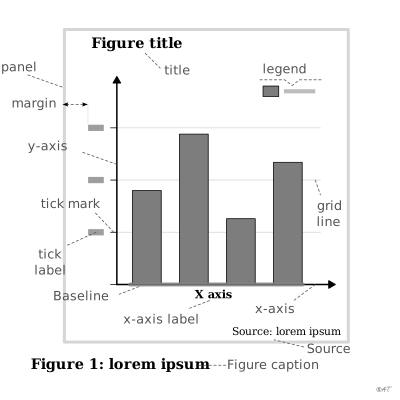
figure title
also: chart titleText announcing what a figure is about.
titre
Texte qui annonce le sujet d'une figure.
Wilke le place en tête de la légende de figure dans une publication scientifique plutôt qu'au-dessus du graphique.
Classification
- process
Attestation
- French term: Lagnel, Manuel de datavisualisation, Dunod, 2021
- English definition: Wilke, Fundamentals of Data Visualization, O'Reilly, 2019
Sources (39)
114 occurrences in the corpus; indexed by 1 book
Show the 39 sources
- Audric, de Bellefon & Durieux, « Analyse spatiale descriptive », Manuel d'analyse spatiale (Insee Méthodes n° 131), 2018
- Barnier, Introduction à R et au tidyverse
- Better data visualizations: a guide for scholars, researchers, and wonks
- Computational statistics in data science
- Data Feminism
- Data story: explain data and inspire action through story
- Data visualization handbook
- Dehaene, “The Perception of Graphics: A New Instance of Neuronal Recycling”, lecture course at the Collège de France, 2025 (in French)↗
- Effective data visualization: the right chart for the right data
- French Wikipedia — Visualisation de données
- Giraud & Pecout, Géomatique et cartographie avec R
- Grosjean & Engels, Science des données biologiques I-III (University of Mons)
- Information graphics
- Information Graphics: A Comprehensive Illustrated Reference
- Insee, Guide de sémiologie graphique, édition 2017↗
- L’Atlas Molière
- La graphique et le traitement graphique de l'information
- Lagarenne, Minodier & Samson, « Comment présenter nos données pour mieux communiquer ? La datavisualisation : synthèse et simplicité », Courrier des statistiques n° 10 (Insee), 2023↗
- Lagnel, Manuel de datavisualisation, Dunod, 2021
- Larmarange et al., analyse-R: introduction to survey analysis with R
- Larmarange, guide-R: analysing survey data with R
- Les fondamentaux de la visualisation de données
- Magrit user manual, French version (UAR RIATE, CNRS)
- Manuel de datavisualisation - 2e éd, vol. 2
- PBIL biostatistics notes (Chessel, Dufour, Thioulouse et al., Lyon 1)
- PLOS, figure guidelines↗
- Practical charts: the essential guide to creating clear, compelling charts for reports ...
- QCBS R Workshop Series, French version (Quebec Centre for Biodiversity Science)
- Rakotomalala, statistics course notes (Université Lyon 2)
- RGAA, French accessibility framework: glossary, criteria and tests
- Semiologie graphique: les diagrammes, les réseaux, les cartes.
- Semiology of graphics: diagrams, networks, maps
- Show me the numbers: designing tables and graphs to enlighten
- The big book of dashboards: visualizing your data using real-world business scenarios
- utilitR, collaborative R documentation (Insee)
- visionscarto.net↗
- Visual complexity: mapping patterns of information
- Web Content Accessibility Guidelines (WCAG) 2.1, authorized French translation (W3C)
- Wilke, Fundamentals of Data Visualization, O'Reilly, 2019
Cite this entry
Stable addresshttps://dataviz.adrientaudiere.com/en/term/figure-title.html
ReferenceTaudière Adrien. 2026. figure title. In Visualization Vocabulary, version 1.0.0. IdEst. https://dataviz.adrientaudiere.com/en/term/figure-title.html
BibTeX
@incollection{taudiere2026-figure-title,
  author    = {Taudière, Adrien},
  title     = {figure title},
  booktitle = {Visualization Vocabulary},
  year      = {2026},
  version   = {1.0.0},
  publisher = {IdEst},
  url       = {https://dataviz.adrientaudiere.com/en/term/figure-title.html},
  note      = {CC0 1.0}
}Page created on 2026-10-13. Text last changed on 2026-10-13. Images last changed on 2026-10-22. Numbers computed on 2026-10-22.