

 chart
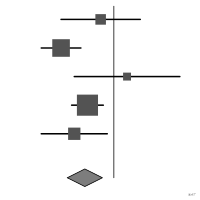
forest plot
Effects and confidence intervals of several studies aligned.
graphique en forêt
aussi : forest plotEffets et intervalles de confiance de plusieurs études alignés.
Standard des méta-analyses.
Classification
- chart
- points and bubbles › dots and intervals
- deviation
- the name evokes: nature
Channels
 position on common scale; main: effect
 length; main: confidence interval
 area; main: weight of the study (square size)
 spatial region; main: study
 shape; secondary: pooled estimate (diamond)
Attestation
- French term: French Wikipedia↗
Scientific literature
OpenAlex: 10 330 papers since 1979, 59% in the last five years; mostly in Medicine, Biochemistry, Genetics and Molecular Biology, Decision Sciences; Wikidata
Seminal references
- naming (2001) Lewis & Clarke (2001). Forest plots: trying to see the wood and the trees. BMJ (772 citations)
R packages
- R
metafor::forest(); GitHub 317 stars; last commit 2026-10; paper (20 481 citations) - R
forestploter::forest(); GitHub 127 stars; last commit 2026-09 - R
forestplot::forestplot(); GitHub 52 stars; last commit 2026-03; paper (94 citations) - R
metaviz::viz_forest(); GitHub 18 stars; last commit 2026-09; paper (29 citations)
R code of the ggplot2 example
library(ggplot2)
library(dplyr)
library(HistData)
## Rate ratio of vaccinated children to their controls, with its 95%
## interval on the log scale: 1 / a + 1 / b is the variance of log(ratio).
ratio <- function(a, n_a, b, n_b) {
r <- (a / n_a) / (b / n_b)
half <- qnorm(0.975) * sqrt(1 / a + 1 / b)
c(ratio = r, low = r * exp(-half), high = r * exp(half))
}
trials <- PolioTrials |>
filter(Group %in% c("Vaccinated", "Placebo", "Controls"))
rows <- bind_rows(lapply(c("Paralytic", "NonParalytic"), function(case) {
bind_rows(lapply(c("RandomizedControl", "ObservedControl"), function(design) {
t <- filter(trials, Experiment == design)
v <- t[t$Group == "Vaccinated", ]
k <- t[t$Group != "Vaccinated", ]
tibble(case = case, design = design,
!!!as.list(ratio(v[[case]], v$Population, k[[case]], k$Population)))
}))
})) |>
mutate(label = paste0(ifelse(case == "Paralytic", "Paralytic", "Non-paralytic"), ", ",
ifelse(design == "RandomizedControl", "placebo trial", "observed controls")),
label = factor(label, levels = rev(label)))
p <- ggplot(rows, aes(x = ratio, y = label)) +
geom_vline(xintercept = 1, colour = "#535353", linewidth = 0.4, linetype = "dashed") +
geom_errorbar(aes(xmin = low, xmax = high), width = 0.2, orientation = "y", colour = "#9b2367", linewidth = 0.5) +
geom_point(shape = 15, size = 2.4, colour = "#9b2367") +
scale_x_log10(breaks = c(0.25, 0.5, 1, 2), labels = c("0.25", "0.5", "1", "2")) +
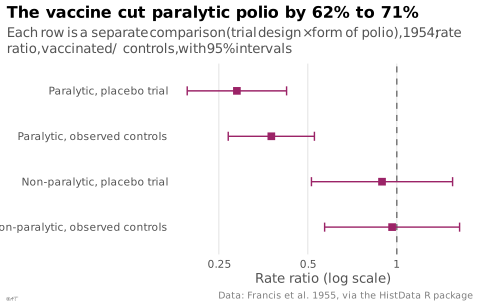
labs(title = "The vaccine cut paralytic polio by 62% to 71%",
subtitle = "Each row is a separate comparison (trial design × form of polio), 1954; rate ratio, vaccinated / controls, with 95% intervals",
x = "Rate ratio (log scale)", y = NULL,
caption = "Data: Francis et al. 1955, via the HistData R package") +
theme_lex_viz(grid = "x", arrows = "")Sources (6)
2 occurrences in the corpus
Cite this entry
Stable addresshttps://dataviz.adrientaudiere.com/en/term/forest-plot.html
ReferenceTaudière Adrien. 2026. forest plot. In Visualization Vocabulary, version 1.0.0. IdEst. https://dataviz.adrientaudiere.com/en/term/forest-plot.html
BibTeX
@incollection{taudiere2026-forest-plot,
  author    = {Taudière, Adrien},
  title     = {forest plot},
  booktitle = {Visualization Vocabulary},
  year      = {2026},
  version   = {1.0.0},
  publisher = {IdEst},
  url       = {https://dataviz.adrientaudiere.com/en/term/forest-plot.html},
  note      = {CC0 1.0}
}Page created on 2026-10-13. Text last changed on 2026-11-02. Images last changed on 2026-11-12. Numbers computed on 2026-10-22.