
 process
headline
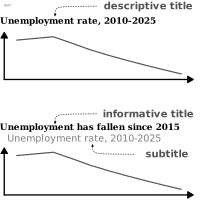
also: active title, takeaway title, informative titleTitle stating the conclusion to draw from the chart rather than its topic.
titre informatif
aussi : titre-messageTitre qui énonce la conclusion à tirer du graphique plutôt que son sujet.
Pour Muth le titre est une hypothèse : il promet au lecteur ce qu'il va voir.
Classification
- process
Attestation
Sources (40)
131 occurrences in the corpus; indexed by 5 books
Show the 40 sources
- analysisfunction.civilservice.gov.uk
- Audric, de Bellefon & Durieux, « Analyse spatiale descriptive », Manuel d'analyse spatiale (Insee Méthodes n° 131), 2018
- Beautiful evidence
- Better data visualizations: a guide for scholars, researchers, and wonks
- Building Science Graphics: An Illustrated Guide to Communicating Science through Diagra...
- Cartographies of Time
- Data Feminism
- Data Visualisation Guide, data.europa.eu
- Data visualisation: a handbook for data driven design
- Data visualization handbook
- Data visualization: a practical introduction
- Data-driven storytelling
- datawrapper.de↗
- Effective data storytelling: how to drive change with data, narrative, and visuals
- Effective data visualization: the right chart for the right data
- Friendly & Wainer, A History of Data Visualization and Graphic Communication, Harvard University Press, 2021
- Graphics for learning: proven guidelines for planning, designing, and evaluating visual...
- Handling and mapping geographic information
- How charts lie: getting smarter about visual information
- How to lie with statistics
- Info we trust: how to inspire the world with data
- Information graphics
- Insee, Guide de sémiologie graphique, édition 2017↗
- Living in data: a citizen's guide to a better information
- Making and Breaking the Grid, Third Edition
- Open Visualization Academy, courses and newsletter (Cairo et al.)
- PBIL biostatistics notes (Chessel, Dufour, Thioulouse et al., Lyon 1)
- Questions in Dataviz: A Design-Driven Process for Data Visualisation
- Storytelling with data: let's practice!
- The art of insight: how great visualization designers think
- The big book of dashboards: visualizing your data using real-world business scenarios
- The elements of graphing data
- The functional art: an introduction to information graphics and visualization
- The Truthful Art: Data, Charts, and Maps for Communication
- The Wall Street journal guide to information graphics: the dos and don'ts of presenting...
- Visual complexity: mapping patterns of information
- Visual strategies for biological data
- Visualizing with text
- wiki.wordsoftype.com
- Wikipedia in English↗
Cite this entry
Stable addresshttps://dataviz.adrientaudiere.com/en/term/headline.html
ReferenceTaudière Adrien. 2026. headline. In Visualization Vocabulary, version 1.0.0. IdEst. https://dataviz.adrientaudiere.com/en/term/headline.html
BibTeX
@incollection{taudiere2026-headline,
  author    = {Taudière, Adrien},
  title     = {headline},
  booktitle = {Visualization Vocabulary},
  year      = {2026},
  version   = {1.0.0},
  publisher = {IdEst},
  url       = {https://dataviz.adrientaudiere.com/en/term/headline.html},
  note      = {CC0 1.0}
}Page created on 2026-10-13. Text last changed on 2026-11-10. Images last changed on 2026-11-09. Numbers computed on 2026-10-22.