
 chart
lollipop chart
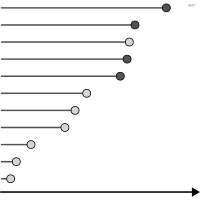
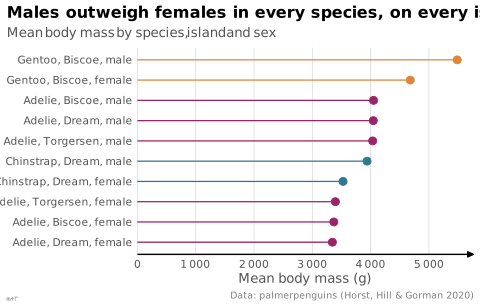
Thin stem topped by a dot replacing the bar.
graphique en sucettes
aussi : diagramme en bâtons à pointsTige fine terminée par un point remplaçant la barre.
Réduit l'encre par rapport aux barres pour les longues listes.
Classification
- chart
- bars › simple bars
- ranking, magnitude; Financial Times Visual Vocabulary
- the name evokes: food
Channels
 position on common scale; main: value (the dot carries the value)
 length; secondary: value
 spatial region; main: category
Attestation and synonyms
Scientific literature
OpenAlex: 24 papers since 2020, 79% in the last five years; mostly in Computer Science, Biochemistry, Genetics and Molecular Biology, Medicine
R packages
- R
ggalt::geom_lollipop(); GitHub 690 stars; last commit 2026-05 Retiré du CRAN : à installer depuis GitHub.
R code of the ggplot2 example
library(ggplot2)
library(dplyr)
library(palmerpenguins)
body_mass <- penguins |>
filter(!is.na(sex)) |>
group_by(species, island, sex) |>
summarise(mass = mean(body_mass_g), .groups = "drop") |>
mutate(group = paste(species, island, sex, sep = ", "),
group = reorder(group, mass))
p <- ggplot(body_mass, aes(x = mass, y = group, colour = species)) +
geom_segment(aes(x = 0, xend = mass, yend = group)) +
geom_point(size = 2.5) +
scale_x_continuous(labels = lex_number, expand = expansion(mult = c(0, 0.05))) +
labs(title = "Males outweigh females in every species, on every island",
subtitle = "Mean body mass by species, island and sex",
x = "Mean body mass (g)", y = NULL,
caption = "Data: palmerpenguins (Horst, Hill & Gorman 2020)") +
theme_lex_viz(grid = "x", arrows = "x") +
theme(legend.position = "none")Sources (13)
23 occurrences in the corpus; indexed by 3 books
Show the 13 sources
- analysisfunction.civilservice.gov.uk
- app.flourish.studio
- Better data visualizations: a guide for scholars, researchers, and wonks
- Data visualisation: a handbook for data driven design
- Data visualization handbook
- Data Viz Project
- dataphys.org
- datavizproject.com
- Effective data storytelling: how to drive change with data, narrative, and visuals
- Effective data visualization: the right chart for the right data
- Larmarange et al., analyse-R: introduction to survey analysis with R
- The big book of dashboards: visualizing your data using real-world business scenarios
- The Truthful Art: Data, Charts, and Maps for Communication
Cite this entry
Stable addresshttps://dataviz.adrientaudiere.com/en/term/lollipop-chart.html
ReferenceTaudière Adrien. 2026. lollipop chart. In Visualization Vocabulary, version 1.0.0. IdEst. https://dataviz.adrientaudiere.com/en/term/lollipop-chart.html
BibTeX
@incollection{taudiere2026-lollipop-chart,
  author    = {Taudière, Adrien},
  title     = {lollipop chart},
  booktitle = {Visualization Vocabulary},
  year      = {2026},
  version   = {1.0.0},
  publisher = {IdEst},
  url       = {https://dataviz.adrientaudiere.com/en/term/lollipop-chart.html},
  note      = {CC0 1.0}
}Page created on 2026-10-13. Text last changed on 2026-11-02. Images last changed on 2026-11-12. Numbers computed on 2026-10-22.