
 chart
Marimekko chart
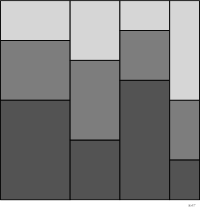
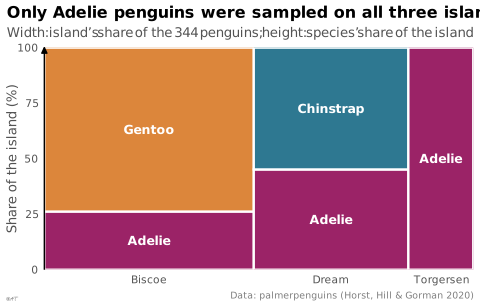
also: mosaic plotRectangles whose width and height encode two proportions.
graphique Marimekko
aussi : diagramme en mosaïqueRectangles dont largeur et hauteur codent deux proportions.
Classification
- chart
- sectors, tilings and units › tilings
- magnitude, part-to-whole; Financial Times Visual Vocabulary
- the name evokes: object
Channels
 length; main: share of the two variables (width and height)
 area; secondary: count of the combination
 spatial region; secondary: group
 color hue; main: category
Attestation
- French term: Lagnel, Manuel de datavisualisation, Dunod, 2021
- English definition: Data Visualisation Guide, data.europa.eu
Scientific literature
OpenAlex: 198 papers since 1999, 32% in the last five years; mostly in Computer Science, Mathematics, Medicine; Wikidata
Seminal references
- first known use (1874) von Mayr (1874). Gutachten über die Anwendung der graphischen und geographischen Methode in der Statistik, Fig. VIII. Zeitschrift des Königlich-Bayerischen Statistischen Bureaus, 6; Andrews 2017
- formalization (1994) Friendly (1994). Mosaic Displays for Multi-Way Contingency Tables. Journal of the American Statistical Association (404 citations)
R packages
- R
ggmosaic::geom_mosaic(); GitHub 172 stars; last commit 2026-04 Retiré du CRAN : à installer depuis GitHub. - R
ggmosaic2::geom_mosaic(); GitHub 3 stars; last commit 2026-09; paper (0 citations)
R code of the ggplot2 example
library(ggplot2)
library(dplyr)
library(palmerpenguins)
## Each island is as wide as its share of the penguins; within it, each
## species is as tall as its share of the island.
islands <- penguins |>
count(island, name = "total") |>
mutate(xmax = 100 * cumsum(total) / sum(total),
xmin = lag(xmax, default = 0))
blocks <- penguins |>
count(island, species) |>
left_join(islands, by = "island") |>
group_by(island) |>
mutate(ymax = 100 * cumsum(n) / total,
ymin = lag(ymax, default = 0)) |>
ungroup()
p <- ggplot(blocks) +
geom_rect(aes(xmin = xmin, xmax = xmax, ymin = ymin, ymax = ymax, fill = species),
colour = "white", linewidth = 0.8) +
geom_text(aes(x = (xmin + xmax) / 2, y = (ymin + ymax) / 2, label = species),
colour = "white", fontface = "bold", size = 3.3) +
scale_x_continuous(breaks = (islands$xmin + islands$xmax) / 2, labels = islands$island,
expand = c(0, 0)) +
scale_y_continuous(labels = lex_number, expand = c(0, 0)) +
labs(title = "Only Adelie penguins were sampled on all three islands",
subtitle = "Width: island's share of the 344 penguins; height: species' share of the island",
x = NULL, y = "Share of the island (%)",
caption = "Data: palmerpenguins (Horst, Hill & Gorman 2020)") +
theme_lex_viz(grid = "", arrows = "y") +
theme(legend.position = "none")Sources (17)
45 occurrences in the corpus; indexed by 7 books
Show the 17 sources
- Better data visualizations: a guide for scholars, researchers, and wonks
- Bremer & Barone, Chart, CRC Press, 2025
- Data points: visualization that means something
- Data Visualisation Guide, data.europa.eu
- Data visualisation: a handbook for data driven design
- Data visualization handbook
- Data Viz Project
- datavizcatalogue.com
- datavizproject.com
- datawrapper.de↗
- Lagnel, Manuel de datavisualisation, Dunod, 2021
- Manuel de datavisualisation - 2e éd, vol. 2
- Milestones in the history of thematic cartography, statistical graphics, and data visua...
- The grammar of graphics
- Visualizing with text
- Wikipedia — Data and information visualization
- Wikipedia in English↗
Cite this entry
Stable addresshttps://dataviz.adrientaudiere.com/en/term/marimekko.html
ReferenceTaudière Adrien. 2026. Marimekko chart. In Visualization Vocabulary, version 1.0.0. IdEst. https://dataviz.adrientaudiere.com/en/term/marimekko.html
BibTeX
@incollection{taudiere2026-marimekko,
  author    = {Taudière, Adrien},
  title     = {Marimekko chart},
  booktitle = {Visualization Vocabulary},
  year      = {2026},
  version   = {1.0.0},
  publisher = {IdEst},
  url       = {https://dataviz.adrientaudiere.com/en/term/marimekko.html},
  note      = {CC0 1.0}
}Page created on 2026-10-13. Text last changed on 2026-10-22. Images last changed on 2026-11-12. Numbers computed on 2026-10-22.