

 chart
parallel coordinates
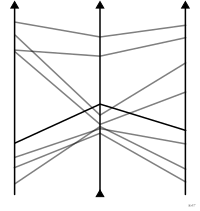
also: parallel coordinate plotParallel axes crossed by one polyline per observation.
coordonnées parallèles
Axes parallèles traversés par une ligne brisée par observation.
Classification
- chart
- lines and areas › lines
- magnitude; Financial Times Visual Vocabulary
Channels
 position on unaligned scale; main: value on each axis (one axis, one scale); Munzner 2014
 tilt/angle; main: link between variables; Munzner 2014
 spatial region; main: variable (order of the axes); Munzner 2014
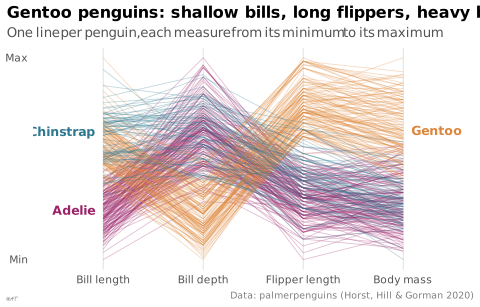
 color hue; secondary: group; Munzner 2014
Variants
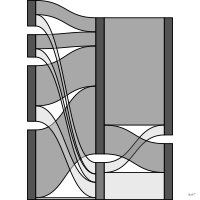 parallel setscategorical variables and counts
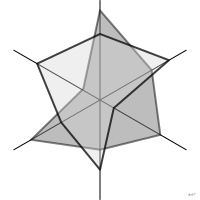 radar chartradial axes
Attestation
- French term: Andry, Kieffer & Lambotte, Les fondamentaux de la visualisation de données, De Boeck, 2022
- English definition: Data Visualisation Guide, data.europa.eu
Scientific literature
OpenAlex: 1 334 papers since 1983, 15% in the last five years; mostly in Computer Science, Engineering, Biochemistry, Genetics and Molecular Biology; Wikidata
Seminal references
- first known use (1885) d'Ocagne (1885). Coordonnées parallèles et axiales. Gauthier-Villars; Ciuccarelli 2026, Andrews 2017
- formalization (1985) Inselberg (1985). The plane with parallel coordinates. The Visual Computer (1 446 citations); Ciuccarelli 2026
- formalization (1990) Wegman (1990). Hyperdimensional data analysis using parallel coordinates. Journal of the American Statistical Association (698 citations); Friendly & Denis 2001
R packages
- R
GGally::ggparcoord(); GitHub 617 stars; last commit 2026-10
R code of the ggplot2 example
library(ggplot2)
library(dplyr)
library(tidyr)
library(palmerpenguins)
measures <- c(`Bill length` = "bill_length_mm", `Bill depth` = "bill_depth_mm",
`Flipper length` = "flipper_length_mm", `Body mass` = "body_mass_g")
## Each measure rescaled from its minimum (0) to its maximum (1).
lines <- penguins |>
filter(!is.na(body_mass_g)) |>
mutate(penguin = row_number()) |>
select(penguin, species, all_of(measures)) |>
pivot_longer(all_of(names(measures)), names_to = "measure") |>
mutate(measure = factor(measure, levels = names(measures))) |>
group_by(measure) |>
mutate(value = (value - min(value)) / (max(value) - min(value))) |>
ungroup()
## Each species is named on the axis where it stands apart.
ends <- lines |>
group_by(species, measure) |>
summarise(value = median(value), .groups = "drop") |>
filter(measure == ifelse(species == "Gentoo", "Body mass", "Bill length")) |>
mutate(right = measure == "Body mass")
p <- ggplot(lines, aes(x = measure, y = value, group = penguin, colour = species)) +
geom_line(alpha = 0.3, linewidth = 0.3) +
geom_text(data = ends, aes(label = species, group = NULL, hjust = ifelse(right, 0, 1),
x = as.numeric(measure) + ifelse(right, 0.08, -0.08)),
size = 3.3, fontface = "bold") +
scale_x_discrete(expand = expansion(add = c(0.7, 0.7))) +
scale_y_continuous(breaks = c(0, 1), labels = c("Min", "Max")) +
labs(title = "Gentoo penguins: shallow bills, long flippers, heavy bodies",
subtitle = "One line per penguin, each measure from its minimum to its maximum",
x = NULL, y = NULL,
caption = "Data: palmerpenguins (Horst, Hill & Gorman 2020)") +
theme_lex_viz(grid = "x", arrows = "") +
theme(legend.position = "none")Sources (40)
345 occurrences in the corpus; indexed by 9 books
Show the 40 sources
- Andry, Kieffer & Lambotte, Les fondamentaux de la visualisation de données, De Boeck, 2022
- app.flourish.studio
- Better data visualizations: a guide for scholars, researchers, and wonks
- Computational statistics in data science
- Cook & Laa, Interactively Exploring High-Dimensional Data and Models in R, Chapman & Hall/CRC, 2026
- Data points: visualization that means something
- Data Visualisation Guide, data.europa.eu
- Data visualisation: a handbook for data driven design
- Data Viz Project
- data-to-viz.com
- dataphys.org
- datavizcatalogue.com
- datavizproject.com
- Design for information: an introduction to the histories, theories, and best practices ...
- Effective data visualization: the right chart for the right data
- French Wikipedia↗
- Friendly & Wainer, A History of Data Visualization and Graphic Communication, Harvard University Press, 2021
- From data to viz
- Fundamentals of computer graphics
- How charts lie: getting smarter about visual information
- Information Graphics: A Comprehensive Illustrated Reference
- Information theory tools for visualization
- Interactive data visualization: foundations, techniques, and applications
- Les fondamentaux de la visualisation de données
- Milestones in the history of thematic cartography, statistical graphics, and data visua...
- Parallel sets: visual analysis of categorical data
- Practical charts: the essential guide to creating clear, compelling charts for reports ...
- Progressive Data Analysis: Roadmap and Research Agenda
- The eyes have it: A task by data type taxonomy for information visualizations
- The golden age of data visualization: how did we get here?
- The grammar of graphics
- The Truthful Art: Data, Charts, and Maps for Communication
- Thematic Cartography and Geovisualization
- Visual strategies for biological data
- Visualization Analysis and Design
- Visualization of Time-Oriented Data
- Visualize This
- Visualizing with text
- Wikipedia — Data and information visualization
- Wikipedia in English↗
Cite this entry
Stable addresshttps://dataviz.adrientaudiere.com/en/term/parallel-coordinates.html
ReferenceTaudière Adrien. 2026. parallel coordinates. In Visualization Vocabulary, version 1.0.0. IdEst. https://dataviz.adrientaudiere.com/en/term/parallel-coordinates.html
BibTeX
@incollection{taudiere2026-parallel-coordinates,
  author    = {Taudière, Adrien},
  title     = {parallel coordinates},
  booktitle = {Visualization Vocabulary},
  year      = {2026},
  version   = {1.0.0},
  publisher = {IdEst},
  url       = {https://dataviz.adrientaudiere.com/en/term/parallel-coordinates.html},
  note      = {CC0 1.0}
}Page created on 2026-10-13. Text last changed on 2026-11-10. Images last changed on 2026-11-02. Numbers computed on 2026-10-22.