
 chart
rarefaction curve
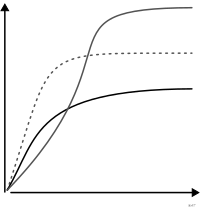
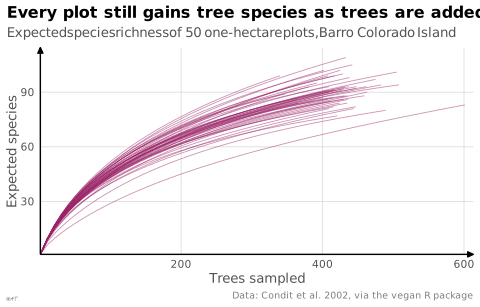
Expected richness as a function of sampling effort.
courbe de raréfaction
Richesse attendue en fonction de l'effort d'échantillonnage.
Un plateau suggère un échantillonnage suffisant, jamais qu'il est exhaustif. Vérifié : absent du corpus book_dataviz, qui ne couvre pas l'écologie numérique. Attesté par la fonction vegan::rarefy(), mais vegan n'est pas un ouvrage de la collection Zotero.
Classification
- chart
- lines and areas › statistical curves
- correlation
Channels
 position on common scale; main: richness; effort on the x-axis
 tilt/angle; secondary: richness gain (slope: does the curve level off?)
 color hue; secondary: sample
Attestation
Scientific literature
OpenAlex: 1 220 papers since 1982, 30% in the last five years; mostly in Environmental Science, Agricultural and Biological Sciences, Biochemistry, Genetics and Molecular Biology
Seminal references
- invention (1968) Sanders (1968). Marine Benthic Diversity: A Comparative Study. The American Naturalist (2 432 citations)
R packages
- R
vegan::rarecurve(); GitHub 551 stars; last commit 2026-10 - R
iNEXT::ggiNEXT(); GitHub 9 stars; last commit 2025-07; paper (4 470 citations) - R
divent::accum_hill(); GitHub 3 stars; last commit 2026-11 Tracé par autoplot().
R code of the ggplot2 example
library(ggplot2)
library(vegan)
## Trees of 10 cm or more in diameter, fifty plots of one hectare.
data(BCI)
curves <- rarecurve(BCI, step = 10, tidy = TRUE)
p <- ggplot(curves, aes(x = Sample, y = Species, group = Site)) +
geom_line(linewidth = 0.3, alpha = 0.5, colour = "#9b2367") +
scale_x_continuous(labels = lex_number, expand = expansion(mult = c(0, 0.02))) +
scale_y_continuous(labels = lex_number, expand = expansion(mult = c(0, 0.05))) +
labs(title = "Every plot still gains tree species as trees are added",
subtitle = "Expected species richness of 50 one-hectare plots, Barro Colorado Island",
x = "Trees sampled", y = "Expected species",
caption = "Data: Condit et al. 2002, via the vegan R package") +
theme_lex_viz(grid = "xy")Sources (1)
Cite this entry
Stable addresshttps://dataviz.adrientaudiere.com/en/term/rarefaction-curve.html
ReferenceTaudière Adrien. 2026. rarefaction curve. In Visualization Vocabulary, version 1.0.0. IdEst. https://dataviz.adrientaudiere.com/en/term/rarefaction-curve.html
BibTeX
@incollection{taudiere2026-rarefaction-curve,
  author    = {Taudière, Adrien},
  title     = {rarefaction curve},
  booktitle = {Visualization Vocabulary},
  year      = {2026},
  version   = {1.0.0},
  publisher = {IdEst},
  url       = {https://dataviz.adrientaudiere.com/en/term/rarefaction-curve.html},
  note      = {CC0 1.0}
}Page created on 2026-10-13. Text last changed on 2026-11-02. Images last changed on 2026-11-12. Numbers computed on 2026-10-22.