
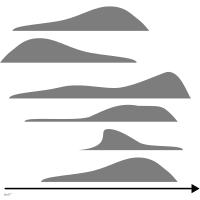
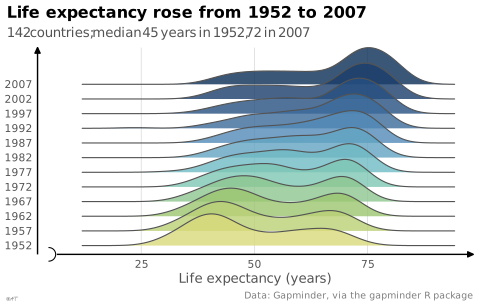
 chart
ridgeline plot
also: joyplotVertically offset densities used to compare distributions.
graphique en crêtes
Densités décalées verticalement pour comparer des distributions.
Ancien nom anglais, à éviter : joy plot, allusion à la pochette de l'album Unknown Pleasures de Joy Division (1979). Le groupe a pris son nom dans House of Dolls (1953), roman de Ka-tzetnik 135633, pseudonyme de Yehiel De-Nur, rescapé d'Auschwitz. Les « Joy Divisions » (Freudenabteilungen) y désignent les bordels des camps de concentration nazis, où des détenues étaient réduites à l'esclavage sexuel. C'est pourquoi Claus Wilke, auteur du paquet R ggjoy, a abandonné ce nom en 2017 pour ridgeline plot et remplacé ggjoy par ggridges (billet « Goodbye joyplots », 15/09/2017).
Classification
- chart
- boxes and densities › density shapes
- distribution
- the name evokes: nature
Channels
 position on common scale; main: value
 spatial region; main: group
 color hue; secondary: group
Attestation and synonyms
- French term: Common usage, not attested by a source
- joy plot; Questions in Dataviz: A Design-Driven Process for Data Visualisation
- graphique en ligne de crête; French Wikipedia↗
Scientific literature
OpenAlex: 52 papers since 2018, 75% in the last five years; mostly in Computer Science, Mathematics, Medicine; Wikidata
Seminal references
R packages
- R
ggridges::geom_density_ridges(); GitHub 426 stars; last commit 2026-06
R code of the ggplot2 example
library(ggplot2)
library(ggridges)
library(gapminder)
p <- ggplot(gapminder, aes(x = lifeExp, y = factor(year), fill = year)) +
geom_density_ridges(aes(group = year), colour = "#535353", alpha = 0.8,
scale = 2.5, linewidth = 0.4) +
scale_x_continuous(labels = lex_number, breaks = lex_break_breaks, expand = lex_break_expand) +
labs(title = "Life expectancy rose from 1952 to 2007",
subtitle = "142 countries; median 45 years in 1952, 72 in 2007",
x = "Life expectancy (years)", y = NULL,
caption = "Data: Gapminder, via the gapminder R package") +
theme_lex_viz(grid = "x", break_not_zero = "x") +
theme(legend.position = "none")Sources (9)
30 occurrences in the corpus; indexed by 3 books
- Better data visualizations: a guide for scholars, researchers, and wonks
- Data visualisation: a handbook for data driven design
- data-to-viz.com
- dataphys.org
- Friendly & Wainer, A History of Data Visualization and Graphic Communication, Harvard University Press, 2021
- From data to viz
- Questions in Dataviz: A Design-Driven Process for Data Visualisation
- Wikipedia in English↗
- Wilke, Fundamentals of Data Visualization, O'Reilly, 2019
Cite this entry
Stable addresshttps://dataviz.adrientaudiere.com/en/term/ridgeline-plot.html
ReferenceTaudière Adrien. 2026. ridgeline plot. In Visualization Vocabulary, version 1.0.0. IdEst. https://dataviz.adrientaudiere.com/en/term/ridgeline-plot.html
BibTeX
@incollection{taudiere2026-ridgeline-plot,
  author    = {Taudière, Adrien},
  title     = {ridgeline plot},
  booktitle = {Visualization Vocabulary},
  year      = {2026},
  version   = {1.0.0},
  publisher = {IdEst},
  url       = {https://dataviz.adrientaudiere.com/en/term/ridgeline-plot.html},
  note      = {CC0 1.0}
}Page created on 2026-10-13. Text last changed on 2026-11-12. Images last changed on 2026-11-12. Numbers computed on 2026-10-22.