
 chart
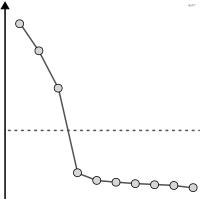
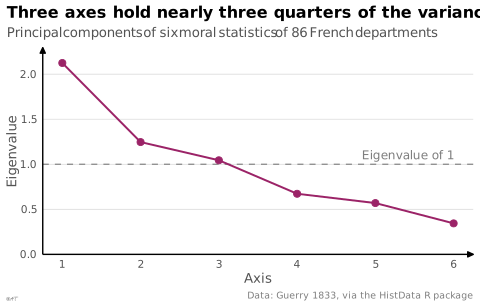
scree plot
Decreasing eigenvalues used to pick the number of axes.
graphique des éboulis
aussi : diagramme des valeurs propresValeurs propres décroissantes servant à choisir le nombre d'axes.
Classification
- chart
- lines and areas › statistical curves
- ranking
- the name evokes: nature
Channels
 position on common scale; main: eigenvalue
 length; secondary: eigenvalue (bar variant)
 tilt/angle; main: gain on each axis (the bend)
Attestation
Scientific literature
OpenAlex: 1 328 papers since 1984, 43% in the last five years; mostly in Medicine, Psychology, Social Sciences; Wikidata
Seminal references
- invention (1966) Cattell (1966). The Scree Test For The Number Of Factors. Multivariate Behavioral Research (14 124 citations)
R packages
- R
factoextra::fviz_eig(); GitHub 389 stars; last commit 2026-07
R code of the ggplot2 example
library(ggplot2)
library(HistData)
moral <- c("Crime_pers", "Crime_prop", "Literacy", "Donations", "Infants", "Suicides")
pca <- prcomp(Guerry[, moral], scale. = TRUE)
eigen <- data.frame(axis = seq_along(pca$sdev), value = pca$sdev^2)
p <- ggplot(eigen, aes(x = axis, y = value)) +
geom_hline(yintercept = 1, colour = "#7d7d7d", linetype = "dashed", linewidth = 0.4) +
annotate("text", x = 6, y = 1, label = "Eigenvalue of 1", colour = "#7d7d7d",
hjust = 1, vjust = -0.6, size = 3.2) +
geom_line(colour = "#9b2367", linewidth = 0.7) +
geom_point(colour = "#9b2367", size = 2.2) +
scale_x_continuous(breaks = eigen$axis) +
scale_y_continuous(labels = lex_number, limits = c(0, NA), expand = expansion(mult = c(0, 0.08))) +
labs(title = "Three axes hold nearly three quarters of the variance",
subtitle = "Principal components of six moral statistics of 86 French departments",
x = "Axis", y = "Eigenvalue",
caption = "Data: Guerry 1833, via the HistData R package") +
theme_lex_viz(grid = "y")Sources (4)
8 occurrences in the corpus
Cite this entry
Stable addresshttps://dataviz.adrientaudiere.com/en/term/scree-plot.html
ReferenceTaudière Adrien. 2026. scree plot. In Visualization Vocabulary, version 1.0.0. IdEst. https://dataviz.adrientaudiere.com/en/term/scree-plot.html
BibTeX
@incollection{taudiere2026-scree-plot,
  author    = {Taudière, Adrien},
  title     = {scree plot},
  booktitle = {Visualization Vocabulary},
  year      = {2026},
  version   = {1.0.0},
  publisher = {IdEst},
  url       = {https://dataviz.adrientaudiere.com/en/term/scree-plot.html},
  note      = {CC0 1.0}
}Page created on 2026-10-13. Text last changed on 2026-10-22. Images last changed on 2026-11-02. Numbers computed on 2026-10-22.