
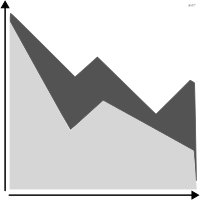
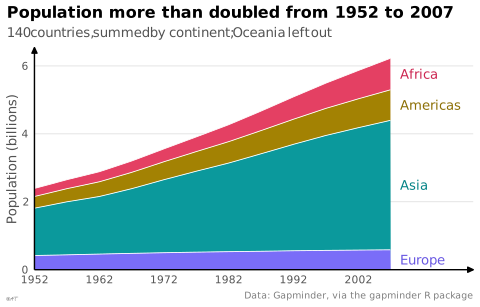
 chart
stacked area chart
also: component curves chart, band chartAreas cumulated on top of one another.
graphique en aires empilées
aussi : courbes pleines superposéesAires cumulées les unes sur les autres.
Classification
- chart
- lines and areas › areas
- change over time, part-to-whole
Channels
 position on common scale; main: total and bottom layer
 position on unaligned scale; main: upper layers
 area; main: upper layers
 color hue; main: series
Variants
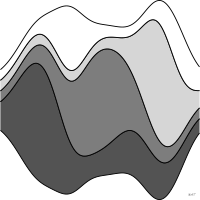 streamgraphfloating baseline
Attestation and synonyms
- French term: Lagnel, Manuel de datavisualisation, Dunod, 2021
- English definition: Brinton, Graphic Presentation, 1939↗
- component curves chart; Brinton, Graphic Presentation, 1939↗
- band chart; Brinton, Graphic Presentation, 1939↗
Scientific literature
OpenAlex: 82 papers since 2002, 43% in the last five years; mostly in Computer Science, Arts and Humanities, Engineering
R packages
- R
ggplot2::geom_area(); GitHub 7 025 stars; last commit 2026-10; paper (33 455 citations) Empile par défaut plusieurs groupes.
R code of the ggplot2 example
library(ggplot2)
library(dplyr)
library(gapminder)
## Oceania, two countries, would be a band too thin to name.
population <- gapminder |>
filter(continent != "Oceania") |>
group_by(continent, year) |>
summarise(pop = sum(pop) / 1e9, .groups = "drop")
## Each name goes after the middle of its band, in 2007; the last level is
## stacked at the bottom.
ends <- population |>
filter(year == max(year)) |>
arrange(desc(continent)) |>
mutate(y = cumsum(pop) - pop / 2)
p <- ggplot(population, aes(x = year, y = pop, fill = continent)) +
geom_area(colour = "white", linewidth = 0.3) +
geom_text(data = ends, aes(x = year, y = y, label = continent, colour = continent),
hjust = 0, nudge_x = 1.5, size = 3.5) +
scale_x_continuous(breaks = seq(1952, 2007, 10), expand = expansion(mult = c(0, 0.2))) +
scale_y_continuous(labels = lex_number, expand = expansion(mult = c(0, 0.05))) +
scale_fill_manual(values = continent_colors) +
scale_colour_manual(values = continent_text_colors) +
labs(title = "Population more than doubled from 1952 to 2007",
subtitle = "140 countries, summed by continent; Oceania left out",
x = NULL, y = "Population (billions)",
caption = "Data: Gapminder, via the gapminder R package") +
theme_lex_viz(grid = "y") +
theme(legend.position = "none")Sources (25)
69 occurrences in the corpus; indexed by 6 books
Show the 25 sources
- Atlas of knowledge: anyone can map
- Better data visualizations: a guide for scholars, researchers, and wonks
- Brinton, Graphic Presentation, 1939↗
- Data points: visualization that means something
- Data Visualisation Guide, data.europa.eu
- Data visualisation: a handbook for data driven design
- Data visualization handbook
- Data Viz Project
- data-to-viz.com
- datavizcatalogue.com
- datavizproject.com
- datawrapper.de↗
- Effective data storytelling: how to drive change with data, narrative, and visuals
- Effective data visualization: the right chart for the right data
- From data to viz
- Graphic presentation
- Lagnel, Manuel de datavisualisation, Dunod, 2021
- Les fondamentaux de la visualisation de données
- Manuel de datavisualisation - 2e éd, vol. 2
- Open Visualization Academy, courses and newsletter (Cairo et al.)
- Practical charts: the essential guide to creating clear, compelling charts for reports ...
- The grammar of graphics
- The Truthful Art: Data, Charts, and Maps for Communication
- Visualize This
- Wikipedia — Data and information visualization
Cite this entry
Stable addresshttps://dataviz.adrientaudiere.com/en/term/stacked-area-chart.html
ReferenceTaudière Adrien. 2026. stacked area chart. In Visualization Vocabulary, version 1.0.0. IdEst. https://dataviz.adrientaudiere.com/en/term/stacked-area-chart.html
BibTeX
@incollection{taudiere2026-stacked-area-chart,
  author    = {Taudière, Adrien},
  title     = {stacked area chart},
  booktitle = {Visualization Vocabulary},
  year      = {2026},
  version   = {1.0.0},
  publisher = {IdEst},
  url       = {https://dataviz.adrientaudiere.com/en/term/stacked-area-chart.html},
  note      = {CC0 1.0}
}Page created on 2026-10-13. Text last changed on 2026-11-12. Images last changed on 2026-11-02. Numbers computed on 2026-10-22.