
 chart
UpSet plot
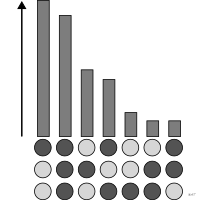
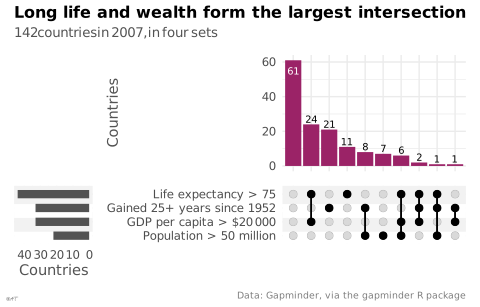
Set intersections shown as bars rather than overlapping circles.
diagramme UpSet
aussi : UpSet plotIntersections d'ensembles montrées en barres plutôt qu'en cercles superposés.
Reste lisible au-delà de quatre ensembles, là où le diagramme de Venn décroche.
Classification
- chart
- sets › set matrices
- part-to-whole
Channels
 position on common scale; main: intersection size
 length; main: intersection size
 spatial region; main: combination of sets (dot matrix)
 color hue; secondary: category
Attestation
Scientific literature
OpenAlex: 291 papers since 2017, 85% in the last five years; mostly in Medicine, Biochemistry, Genetics and Molecular Biology, Computer Science; Wikidata
Seminal references
- invention (2014) Lex et al. (2014). UpSet: Visualization of Intersecting Sets. IEEE Transactions on Visualization and Computer Graphics (2 383 citations)
R packages
- R
UpSetR::upset(); GitHub 842 stars; last commit 2026-05; paper (3 575 citations) - R
ComplexUpset::upset(); GitHub 573 stars; last commit 2025-09; paper (2 343 citations) DOI de la méthode UpSet (Lex et al. 2014), cité par le paquet.
R code of the ggplot2 example
library(ggplot2)
library(dplyr)
library(gapminder)
library(ComplexUpset)
library(patchwork)
## Four sets of countries in 2007; each bar counts the countries in exactly
## that combination of sets.
start <- gapminder |>
filter(year == 1952) |>
select(country, life_1952 = lifeExp)
countries <- gapminder |>
filter(year == 2007) |>
left_join(start, by = "country") |>
transmute(`Life expectancy > 75` = lifeExp > 75,
`GDP per capita > $20 000` = gdpPercap > 20000,
`Population > 50 million` = pop > 5e7,
`Gained 25+ years since 1952` = lifeExp - life_1952 > 25)
p <- upset(countries, names(countries), name = NULL, width_ratio = 0.3, min_size = 1,
base_annotations = list(Countries = intersection_size(fill = "#9b2367", text = list(size = 2.6, family = "Quicksand"))),
set_sizes = upset_set_size(geom = geom_bar(fill = "#535353", width = 0.6)) + ylab("Countries"),
matrix = intersection_matrix(geom = geom_point(size = 2), segment = geom_segment(linewidth = 0.4)),
themes = upset_default_themes(text = element_text(family = "Quicksand", colour = "#535353"))) +
## The plot is a patchwork of three: titles and theme go to the whole.
plot_annotation(title = "Long life and wealth form the largest intersection",
subtitle = "142 countries in 2007, in four sets",
caption = "Data: Gapminder, via the gapminder R package",
theme = theme_lex_viz(grid = "", arrows = "")) &
## Every panel of the patchwork without a background, not only the last.
theme(plot.background = element_rect(fill = NA, colour = NA))Sources (3)
Cite this entry
Stable addresshttps://dataviz.adrientaudiere.com/en/term/upset-plot.html
ReferenceTaudière Adrien. 2026. UpSet plot. In Visualization Vocabulary, version 1.0.0. IdEst. https://dataviz.adrientaudiere.com/en/term/upset-plot.html
BibTeX
@incollection{taudiere2026-upset-plot,
  author    = {Taudière, Adrien},
  title     = {UpSet plot},
  booktitle = {Visualization Vocabulary},
  year      = {2026},
  version   = {1.0.0},
  publisher = {IdEst},
  url       = {https://dataviz.adrientaudiere.com/en/term/upset-plot.html},
  note      = {CC0 1.0}
}Page created on 2026-10-13. Text last changed on 2026-11-12. Images last changed on 2026-11-02. Numbers computed on 2026-10-22.