

 chart
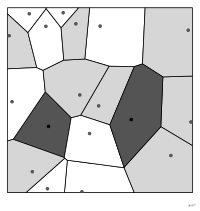
Voronoi diagram
Tiling of the plane into nearest-neighbor cells.
diagramme de Voronoï
aussi : pavage de VoronoïPavage du plan par cellules de plus proche voisin.
Classification
- chart
- sectors, tilings and units › tilings
- part-to-whole; Financial Times Visual Vocabulary
- the name evokes: eponym
Channels
 area; secondary: area of influence (derived from position)
 spatial region; main: generating point
 color hue; secondary: category
Attestation
- French term: Lagnel, Manuel de datavisualisation, Dunod, 2021
- English definition: Data Visualisation Guide, data.europa.eu
Scientific literature
Seminal references
- first known use (1644) Descartes (1644). Principia philosophiae; Wikipedia in English
- formalization (1850) Dirichlet (1850). Über die Reduction der positiven quadratischen Formen mit drei unbestimmten ganzen Zahlen. Journal für die reine und angewandte Mathematik (406 citations); Wikipedia in English
- formalization (1908) Voronoi (1908). Nouvelles applications des paramètres continus à la théorie des formes quadratiques. Journal für die reine und angewandte Mathematik (1 001 citations); Wikipedia in English
R packages
- R
ggforce::geom_voronoi_tile(); GitHub 958 stars; last commit 2025-09
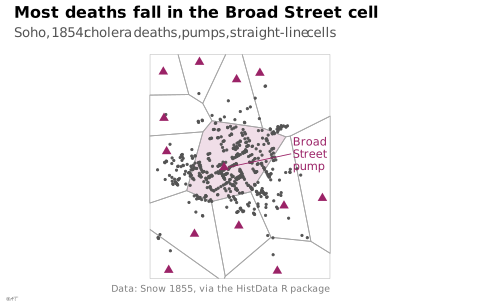
R code of the ggplot2 example
library(ggplot2)
library(dplyr)
library(ggforce)
library(HistData)
## Each pump gets the cell of the points closer to it than to any other pump.
pumps <- Snow.pumps |>
mutate(broad = label == "Broad St")
box <- c(range(c(Snow.deaths$x, Snow.pumps$x)) + c(-0.5, 0.5),
range(c(Snow.deaths$y, Snow.pumps$y)) + c(-0.5, 0.5))
p <- ggplot(pumps, aes(x = x, y = y)) +
geom_voronoi_tile(aes(fill = broad, group = -1L), bound = box, colour = "#a6a6a6",
linewidth = 0.3) +
geom_point(data = Snow.deaths, size = 0.5, colour = "#535353") +
geom_point(shape = 17, size = 2.2, colour = "#9b2367") +
annotate("segment", x = 12.8, y = 11.73, xend = 16.9, yend = 12.6, colour = "#9b2367",
linewidth = 0.3) +
annotate("text", x = 17, y = 12.6, label = "Broad\nStreet\npump", colour = "#9b2367",
hjust = 0, size = 3, lineheight = 0.9) +
scale_fill_manual(values = c(`FALSE` = NA, `TRUE` = "#9b236726")) +
coord_fixed(expand = FALSE) +
labs(title = "Most deaths fall in the Broad Street cell",
subtitle = "Soho, 1854: cholera deaths, pumps, straight-line cells",
caption = "Data: Snow 1855, via the HistData R package") +
theme_lex_viz(grid = "", arrows = "") +
theme(legend.position = "none", axis.text = element_blank(), axis.title = element_blank(),
axis.line = element_blank(), axis.ticks = element_blank(),
plot.title.position = "plot", plot.caption.position = "plot")Sources (14)
21 occurrences in the corpus; indexed by 4 books
Show the 14 sources
- Audric, de Bellefon & Durieux, « Analyse spatiale descriptive », Manuel d'analyse spatiale (Insee Méthodes n° 131), 2018
- Better data visualizations: a guide for scholars, researchers, and wonks
- Data Visualisation Guide, data.europa.eu
- Design for information: an introduction to the histories, theories, and best practices ...
- Effective data storytelling: how to drive change with data, narrative, and visuals
- French Wikipedia↗
- Handling and mapping geographic information
- Information Graphics: A Comprehensive Illustrated Reference
- Lagnel, Manuel de datavisualisation, Dunod, 2021
- Manuel de datavisualisation - 2e éd, vol. 2
- PBIL biostatistics notes (Chessel, Dufour, Thioulouse et al., Lyon 1)
- The book of circles: visualizing spheres of knowledge
- The grammar of graphics
- Wikipedia in English↗
Cite this entry
Stable addresshttps://dataviz.adrientaudiere.com/en/term/voronoi.html
ReferenceTaudière Adrien. 2026. Voronoi diagram. In Visualization Vocabulary, version 1.0.0. IdEst. https://dataviz.adrientaudiere.com/en/term/voronoi.html
BibTeX
@incollection{taudiere2026-voronoi,
  author    = {Taudière, Adrien},
  title     = {Voronoi diagram},
  booktitle = {Visualization Vocabulary},
  year      = {2026},
  version   = {1.0.0},
  publisher = {IdEst},
  url       = {https://dataviz.adrientaudiere.com/en/term/voronoi.html},
  note      = {CC0 1.0}
}Page created on 2026-10-13. Text last changed on 2026-11-06. Images last changed on 2026-11-11. Numbers computed on 2026-10-22.