
 encoding
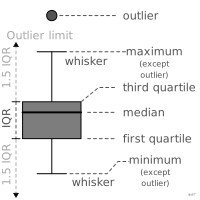
whisker
Segment extending the box out to the retained extreme values.
moustache
Segment prolongeant la boîte jusqu'aux valeurs extrêmes retenues.
Leur règle varie : 1,5 fois l'écart interquartile, les déciles, ou le minimum et le maximum. À préciser.
Classification
- encoding
- the name evokes: nature
Attestation
- French term: Andry, Kieffer & Lambotte, Les fondamentaux de la visualisation de données, De Boeck, 2022
- English definition: Data Visualisation Guide, data.europa.eu
Sources (43)
110 occurrences in the corpus; indexed by 1 book
Show the 43 sources
- Andry, Kieffer & Lambotte, Les fondamentaux de la visualisation de données, De Boeck, 2022
- Applied Multivariate Statistics in R
- Atlas of knowledge: anyone can map
- Ault, Nam Liao & Musolino, Principles of Data Science, OpenStax, 2025
- Barnier, Introduction à R et au tidyverse
- Beautiful evidence
- Better data visualizations: a guide for scholars, researchers, and wonks
- Cartography: thematic map design
- cedricscherer.com↗
- Computational statistics in data science
- Data fluency: empowering your organization with effective data communication
- Data sketches
- Data Visualisation Guide, data.europa.eu
- Data visualisation: a handbook for data driven design
- Data visualization handbook
- Data visualization: a practical introduction
- Effective data visualization: the right chart for the right data
- Exploratory Data Analysis: Descriptive Analysis, Visualization, and Dashboard Design (w...
- Grosjean & Engels, Science des données biologiques I-III (University of Mons)
- Information Graphics: A Comprehensive Illustrated Reference
- Insee, Guide de sémiologie graphique, édition 2017↗
- Larmarange et al., analyse-R: introduction to survey analysis with R
- Larmarange, guide-R: analysing survey data with R
- Les fondamentaux de la visualisation de données
- LibreTexts Statistics, textbook chapters on charts
- Magrit user manual, French version (UAR RIATE, CNRS)
- Milestones in the history of thematic cartography, statistical graphics, and data visua...
- More Practical Charts
- Open Visualization Academy, courses and newsletter (Cairo et al.)
- PBIL biostatistics notes (Chessel, Dufour, Thioulouse et al., Lyon 1)
- Rakotomalala, statistics course notes (Université Lyon 2)
- Show me the numbers: designing tables and graphs to enlighten
- StatsLearn, “Graphs and displays” glossary↗
- The art of insight: how great visualization designers think
- The big book of dashboards: visualizing your data using real-world business scenarios
- The functional art: an introduction to information graphics and visualization
- The Truthful Art: Data, Charts, and Maps for Communication
- Visualization Analysis and Design
- Visualization of Time-Oriented Data
- Wickham, Çetinkaya-Rundel & Grolemund, R for Data Science, 2nd ed., 2023
- Wickham, Navarro & Pedersen, ggplot2: Elegant Graphics for Data Analysis, 3rd ed. online↗
- Wikipedia — Data and information visualization
- Wilke, Fundamentals of Data Visualization, O'Reilly, 2019
Cite this entry
Stable addresshttps://dataviz.adrientaudiere.com/en/term/whisker.html
ReferenceTaudière Adrien. 2026. whisker. In Visualization Vocabulary, version 1.0.0. IdEst. https://dataviz.adrientaudiere.com/en/term/whisker.html
BibTeX
@incollection{taudiere2026-whisker,
  author    = {Taudière, Adrien},
  title     = {whisker},
  booktitle = {Visualization Vocabulary},
  year      = {2026},
  version   = {1.0.0},
  publisher = {IdEst},
  url       = {https://dataviz.adrientaudiere.com/en/term/whisker.html},
  note      = {CC0 1.0}
}Page created on 2026-10-13. Text last changed on 2026-10-13. Images last changed on 2026-10-13. Numbers computed on 2026-10-22.