

 chart
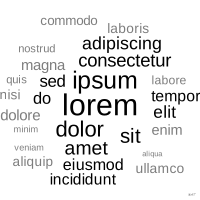
word cloud
also: tag cloudWords whose size encodes frequency.
nuage de mots
Mots dont la taille code la fréquence.
Examples
See the figure at Tugba Kulahcioglu, Gerard de Melo ↗
Classification
- chart
- text
- magnitude
- the name evokes: nature
Channels


Attestation and synonyms
- French term: Lagnel, Manuel de datavisualisation, Dunod, 2021
- English definition: Data Visualisation Guide, data.europa.eu
- nuage de mots-clés; French Wikipedia↗
Scientific literature
OpenAlex: 6 579 papers since 1958, 56% in the last five years; mostly in Computer Science, Social Sciences, Business, Management and Accounting; Wikidata
Seminal references
- first known use (1976) Milgram & Jodelet (1976). Psychological maps of Paris. In Environmental Psychology: People and Their Physical Settings
- first known use (2002) Flanagan (2002). Search Referral Zeitgeist; Friendly & Denis 2001
- diffusion (2009) Viegas et al. (2009). Participatory Visualization with Wordle. IEEE Transactions on Visualization and Computer Graphics (422 citations)
R packages
- R
ggwordcloud::geom_text_wordcloud(); GitHub 176 stars; last commit 2026-02
R code of the ggplot2 example
library(ggplot2)
library(dplyr)
library(tidytext)
library(ggwordcloud)
library(HistData)
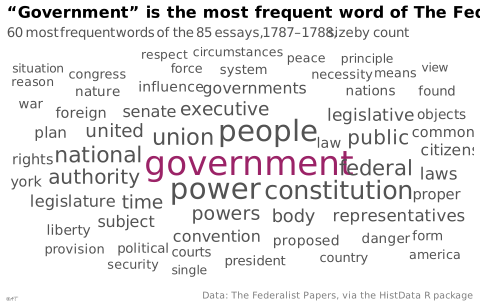
## The 60 most frequent words of the 85 essays, common English words left out.
words <- Federalist_text |>
unnest_tokens(word, text) |>
anti_join(stop_words, by = "word") |>
count(word, sort = TRUE) |>
slice_head(n = 60) |>
mutate(top = row_number() == 1)
set.seed(1)
p <- ggplot(words, aes(label = word, size = n, colour = top)) +
geom_text_wordcloud(family = "Quicksand", eccentricity = 0.6, rm_outside = TRUE) +
scale_size_area(max_size = 9) +
scale_colour_manual(values = c(`FALSE` = "#535353", `TRUE` = "#9b2367")) +
labs(title = "“Government” is the most frequent word of The Federalist",
subtitle = "60 most frequent words of the 85 essays, 1787–1788, size by count",
caption = "Data: The Federalist Papers, via the HistData R package") +
theme_lex_viz(grid = "", arrows = "") +
theme(axis.text = element_blank())Sources (25)
105 occurrences in the corpus; indexed by 9 books
Show the 25 sources
- app.flourish.studio
- Atlas of knowledge: anyone can map
- Better data visualizations: a guide for scholars, researchers, and wonks
- Data sketches
- Data Visualisation Guide, data.europa.eu
- Data visualisation: a handbook for data driven design
- Data visualization handbook
- Data Viz Project
- datavizcatalogue.com
- datavizproject.com
- Design for information: an introduction to the histories, theories, and best practices ...
- Effective data visualization: the right chart for the right data
- Exploratory Data Analysis: Descriptive Analysis, Visualization, and Dashboard Design (w...
- French Wikipedia↗
- Interactive data visualization: foundations, techniques, and applications
- Lagnel, Manuel de datavisualisation, Dunod, 2021
- Manuel de datavisualisation - 2e éd, vol. 2
- Practical charts: the essential guide to creating clear, compelling charts for reports ...
- The golden age of data visualization: how did we get here?
- Thematic Cartography and Geovisualization
- Visual complexity: mapping patterns of information
- Visualization of Time-Oriented Data
- Visualizing Uncertainty About the Future
- Visualizing with text
- Wikipedia in English↗
Cite this entry
Stable addresshttps://dataviz.adrientaudiere.com/en/term/word-cloud.html
ReferenceTaudière Adrien. 2026. word cloud. In Visualization Vocabulary, version 1.0.0. IdEst. https://dataviz.adrientaudiere.com/en/term/word-cloud.html
BibTeX
@incollection{taudiere2026-word-cloud,
  author    = {Taudière, Adrien},
  title     = {word cloud},
  booktitle = {Visualization Vocabulary},
  year      = {2026},
  version   = {1.0.0},
  publisher = {IdEst},
  url       = {https://dataviz.adrientaudiere.com/en/term/word-cloud.html},
  note      = {CC0 1.0}
}Page created on 2026-10-13. Text last changed on 2026-11-02. Images last changed on 2026-11-09. Numbers computed on 2026-10-22.