
 chart
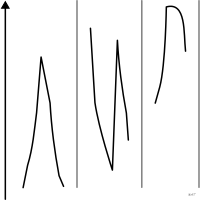
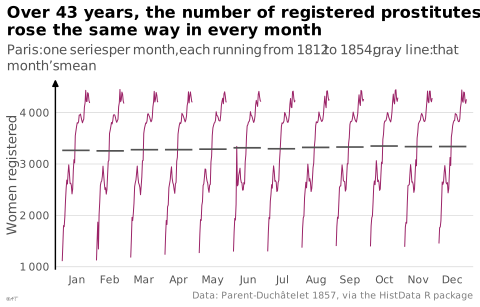
cycle plot
Time series split by phase of the cycle to separate trend from seasonality.
Classification
- chart
- lines and areas › lines
- change over time
Channels
 position on common scale; main: value
 spatial region; main: phase of the cycle (one sub-series per phase)
Attestation
- English definition: Desbarats, More Practical Charts, 2024
Scientific literature
OpenAlex: 67 papers since 1983, 27% in the last five years; mostly in Engineering, Medicine, Agricultural and Biological Sciences
Seminal references
- invention (1982) Cleveland & Terpenning (1982). Graphical Methods for Seasonal Adjustment. Journal of the American Statistical Association (52 citations)
R code of the ggplot2 example
library(ggplot2)
library(dplyr)
library(HistData)
## One small series per month, 1812 to 1854, side by side; the horizontal
## line is that month's mean over the 43 years.
months <- Prostitutes |>
mutate(month = factor(month.abb[mon], levels = month.abb),
x = mon + (Year - 1812) / (1854 - 1812) * 0.8 - 0.4)
means <- months |>
group_by(month, mon) |>
summarise(count = mean(count), .groups = "drop")
p <- ggplot(months, aes(x = x, y = count, group = month)) +
geom_line(linewidth = 0.35, colour = "#9b2367") +
geom_segment(data = means, aes(x = mon - 0.4, xend = mon + 0.4, y = count, yend = count),
colour = "#535353", linewidth = 0.6, inherit.aes = FALSE) +
scale_x_continuous(breaks = 1:12, labels = month.abb, expand = expansion(add = 0.2)) +
scale_y_continuous(labels = lex_number) +
labs(title = "Over 43 years, the number of registered prostitutes\nrose the same way in every month",
subtitle = "Paris: one series per month, each running from 1812 to 1854; gray line: that month's mean",
x = NULL, y = "Women registered",
caption = "Data: Parent-Duchâtelet 1857, via the HistData R package") +
theme_lex_viz(grid = "y", arrows = "y")Sources (9)
29 occurrences in the corpus; indexed by 2 books
- app.flourish.studio
- Data Visualisation Guide, data.europa.eu
- Data visualization handbook
- Desbarats, More Practical Charts, 2024
- Interactive data visualization: foundations, techniques, and applications
- More Practical Charts
- The big book of dashboards: visualizing your data using real-world business scenarios
- Visualization of Time-Oriented Data
- xeno.graphics↗
Cite this entry
Stable addresshttps://dataviz.adrientaudiere.com/en-only/term/cycle-plot.html
ReferenceTaudière Adrien. 2026. cycle plot. In Visualization Vocabulary, version 1.0.0. IdEst. https://dataviz.adrientaudiere.com/en-only/term/cycle-plot.html
BibTeX
@incollection{taudiere2026-cycle-plot,
  author    = {Taudière, Adrien},
  title     = {cycle plot},
  booktitle = {Visualization Vocabulary},
  year      = {2026},
  version   = {1.0.0},
  publisher = {IdEst},
  url       = {https://dataviz.adrientaudiere.com/en-only/term/cycle-plot.html},
  note      = {CC0 1.0}
}Page created on 2026-10-13. Text last changed on 2026-11-02. Images last changed on 2026-11-12. Numbers computed on 2026-10-22.