
 chart
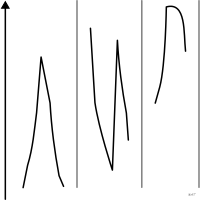
cycle plot
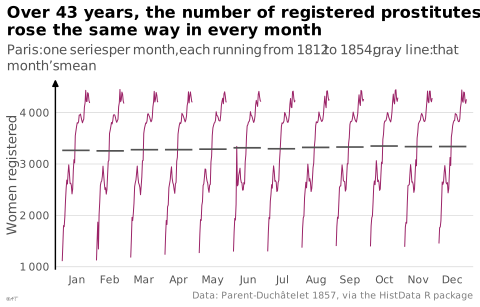
Time series split by phase of the cycle to separate trend from seasonality.
graphique cyclique
Série temporelle découpée par phase du cycle pour séparer la tendance de la saisonnalité.
Chaque mois y porte sa propre sous-courbe, ce qu'une courbe unique masque.
Classification
- chart
- lines and areas › lines
- change over time
Channels
 position on common scale; main: value
 spatial region; main: phase of the cycle (one sub-series per phase)
Attestation
- French term: Common usage, not attested by a source
- English definition: Desbarats, More Practical Charts, 2024
Scientific literature
OpenAlex: 67 papers since 1983, 27% in the last five years; mostly in Engineering, Medicine, Agricultural and Biological Sciences
Seminal references
- invention (1982) Cleveland & Terpenning (1982). Graphical Methods for Seasonal Adjustment. Journal of the American Statistical Association (52 citations)
R code of the ggplot2 example
library(ggplot2)
library(dplyr)
library(HistData)
## One small series per month, 1812 to 1854, side by side; the horizontal
## line is that month's mean over the 43 years.
months <- Prostitutes |>
mutate(month = factor(month.abb[mon], levels = month.abb),
x = mon + (Year - 1812) / (1854 - 1812) * 0.8 - 0.4)
means <- months |>
group_by(month, mon) |>
summarise(count = mean(count), .groups = "drop")
p <- ggplot(months, aes(x = x, y = count, group = month)) +
geom_line(linewidth = 0.35, colour = "#9b2367") +
geom_segment(data = means, aes(x = mon - 0.4, xend = mon + 0.4, y = count, yend = count),
colour = "#535353", linewidth = 0.6, inherit.aes = FALSE) +
scale_x_continuous(breaks = 1:12, labels = month.abb, expand = expansion(add = 0.2)) +
scale_y_continuous(labels = lex_number) +
labs(title = "Over 43 years, the number of registered prostitutes\nrose the same way in every month",
subtitle = "Paris: one series per month, each running from 1812 to 1854; gray line: that month's mean",
x = NULL, y = "Women registered",
caption = "Data: Parent-Duchâtelet 1857, via the HistData R package") +
theme_lex_viz(grid = "y", arrows = "y")Sources (9)
29 occurrences in the corpus; indexed by 2 books
- app.flourish.studio
- Data Visualisation Guide, data.europa.eu
- Data visualization handbook
- Desbarats, More Practical Charts, 2024
- Interactive data visualization: foundations, techniques, and applications
- More Practical Charts
- The big book of dashboards: visualizing your data using real-world business scenarios
- Visualization of Time-Oriented Data
- xeno.graphics↗
Cite this entry
Stable addresshttps://dataviz.adrientaudiere.com/en/term/cycle-plot.html
ReferenceTaudière Adrien. 2026. cycle plot. In Visualization Vocabulary, version 1.0.0. IdEst. https://dataviz.adrientaudiere.com/en/term/cycle-plot.html
BibTeX
@incollection{taudiere2026-cycle-plot,
  author    = {Taudière, Adrien},
  title     = {cycle plot},
  booktitle = {Visualization Vocabulary},
  year      = {2026},
  version   = {1.0.0},
  publisher = {IdEst},
  url       = {https://dataviz.adrientaudiere.com/en/term/cycle-plot.html},
  note      = {CC0 1.0}
}Page created on 2026-10-13. Text last changed on 2026-11-02. Images last changed on 2026-11-12. Numbers computed on 2026-10-22.