
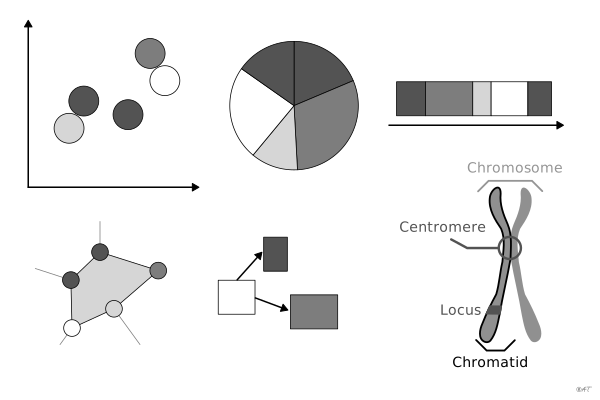

 chart
diagram
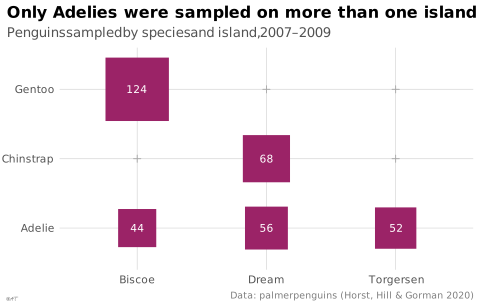
Construction in which “the correspondences in the plane can be established between all the elements of one component and all the elements of another component” (Bertin, translated).
Classification
- chart
Variants
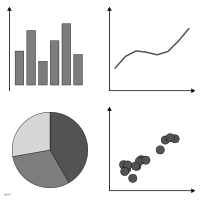 chartspecial case
Attestation
- English definition: Semiology of graphics: diagrams, networks, maps
R code of the ggplot2 example
library(ggplot2)
library(dplyr)
library(palmerpenguins)
## Two components, species and islands, every species set against every
## island: the area of a square codes the number of penguins.
counts <- penguins |>
count(species, island) |>
tidyr::complete(species, island, fill = list(n = 0))
p <- ggplot(counts, aes(x = island, y = species)) +
geom_point(data = filter(counts, n > 0), aes(size = n), shape = 15, colour = "#9b2367") +
geom_point(data = filter(counts, n == 0), shape = 3, size = 1.5, colour = "#a6a6a6") +
geom_text(data = filter(counts, n > 0), aes(label = n), colour = "white", size = 2.8) +
scale_size_area(max_size = 22, guide = "none") +
labs(title = "Only Adelies were sampled on more than one island",
subtitle = "Penguins sampled by species and island, 2007–2009",
x = NULL, y = NULL,
caption = "Data: palmerpenguins (Horst, Hill & Gorman 2020)") +
theme_lex_viz(grid = "xy", arrows = "")Sources (89)
2591 occurrences in the corpus; indexed by 12 books
Show the 89 sources
- 100 diagrams that changed the world: from the earliest cave paintings to the innovation...
- A field guide to digital color
- alg.manifoldapp.org
- app.flourish.studio
- Applied Multivariate Statistics in R
- Atlas of knowledge: anyone can map
- Ault, Nam Liao & Musolino, Principles of Data Science, OpenStax, 2025
- Beautiful evidence
- Better data visualizations: a guide for scholars, researchers, and wonks
- Bremer & Barone, Chart, CRC Press, 2025
- Brilliant Maps for Curious Minds: 100 New Ways to See the World (Maps for Curious Minds)
- Building Science Graphics: An Illustrated Guide to Communicating Science through Diagra...
- Cartographies of Time
- Cartography: thematic map design
- Ciccione et al., The Superiority of Graphics over Text in Long-Term Memory Retention, Psychonomic Bulletin & Review, 2025↗
- Cook & Laa, Interactively Exploring High-Dimensional Data and Models in R, Chapman & Hall/CRC, 2026
- Data Feminism
- Data fluency: empowering your organization with effective data communication
- Data points: visualization that means something
- Data sketches
- Data Visualisation Guide, data.europa.eu
- Data visualisation: a handbook for data driven design
- Data visualization handbook
- Data visualization literacy: Definitions, conceptual frameworks, exercises, and assessm...
- Data Viz Project
- Data-driven storytelling
- data-to-viz.com
- dataphys.org
- datavizcatalogue.com
- datavizproject.com
- datawrapper.de↗
- Design for information: an introduction to the histories, theories, and best practices ...
- Effective data storytelling: how to drive change with data, narrative, and visuals
- Effective data visualization: the right chart for the right data
- Elavsky, Chartability: POUR-CAF accessibility heuristics
- Envisioning information
- Exploratory Data Analysis: Descriptive Analysis, Visualization, and Dashboard Design (w...
- Friendly & Wainer, A History of Data Visualization and Graphic Communication, Harvard University Press, 2021
- From data to viz
- Fundamentals of computer graphics
- Graphic presentation
- Graphics for learning: proven guidelines for planning, designing, and evaluating visual...
- Handling and mapping geographic information
- How charts lie: getting smarter about visual information
- How maps work: representation, visualization, and design
- Info we trust: how to inspire the world with data
- Information graphics
- Information Graphics: A Comprehensive Illustrated Reference
- Information theory tools for visualization
- Interactive data visualization: foundations, techniques, and applications
- LibreTexts Statistics, textbook chapters on charts
- Living in data: a citizen's guide to a better information
- Making and Breaking the Grid, Third Edition
- Making numbers count: the art and science of communicating numbers
- Milestones in the history of thematic cartography, statistical graphics, and data visua...
- Open Visualization Academy, courses and newsletter (Cairo et al.)
- Parallel sets: visual analysis of categorical data
- python-graph-gallery.com
- Questions in Dataviz: A Design-Driven Process for Data Visualisation
- Seeing with fresh eyes: meaning, space, data, truth
- Semiology of graphics: diagrams, networks, maps
- Show me the numbers: designing tables and graphs to enlighten
- sronpersonalpages.nl
- The art of insight: how great visualization designers think
- The book of circles: visualizing spheres of knowledge
- The book of trees: visualizing branches of knowledge
- The eyes have it: A task by data type taxonomy for information visualizations
- The functional art: an introduction to information graphics and visualization
- The golden age of data visualization: how did we get here?
- The grammar of graphics
- The infographic history of the world
- The Minard System: The Complete Statistical Graphics of Charles-Joseph Minard
- The Oxford Handbook of Empirical Aesthetics
- The Truthful Art: Data, Charts, and Maps for Communication
- The Wall Street journal guide to information graphics: the dos and don'ts of presenting...
- Thematic Cartography and Geovisualization
- Visual complexity: mapping patterns of information
- Visual explanations: images and quantities, evidence and narrative
- Visual strategies for biological data
- Visualization Analysis and Design
- Visualization of Time-Oriented Data
- Visualize This
- Visualizing Uncertainty About the Future
- Visualizing with text
- Wickham, Çetinkaya-Rundel & Grolemund, R for Data Science, 2nd ed., 2023
- Wikipedia — Data and information visualization
- Wikipedia in English↗
- Wilke, Fundamentals of Data Visualization, O'Reilly, 2019
- xeno.graphics↗
Cite this entry
Stable addresshttps://dataviz.adrientaudiere.com/en-only/term/diagram.html
ReferenceTaudière Adrien. 2026. diagram. In Visualization Vocabulary, version 1.0.0. IdEst. https://dataviz.adrientaudiere.com/en-only/term/diagram.html
BibTeX
@incollection{taudiere2026-diagram,
  author    = {Taudière, Adrien},
  title     = {diagram},
  booktitle = {Visualization Vocabulary},
  year      = {2026},
  version   = {1.0.0},
  publisher = {IdEst},
  url       = {https://dataviz.adrientaudiere.com/en-only/term/diagram.html},
  note      = {CC0 1.0}
}Page created on 2026-10-13. Text last changed on 2026-11-10. Images last changed on 2026-11-12. Numbers computed on 2026-10-22.