
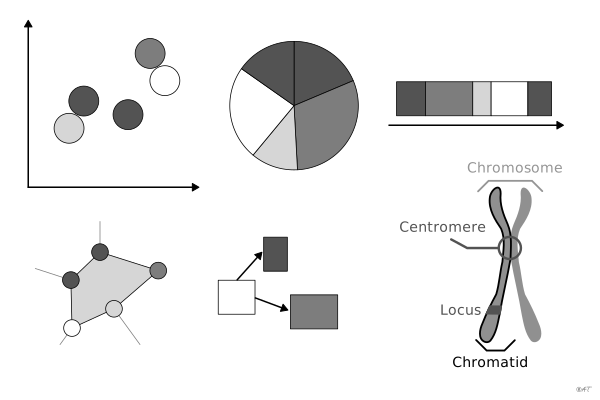

 chart
diagram
Construction in which “the correspondences in the plane can be established between all the elements of one component and all the elements of another component” (Bertin, translated).
diagramme
Construction dont « les correspondances dans le plan peuvent s'établir entre tous les éléments d'une composante et tous les éléments d'une autre composante ».
Sens strict de Bertin : le diagramme est l'un des quatre groupes d'imposition avec le réseau la carte et la symbolique.
Classification
- chart
Variants
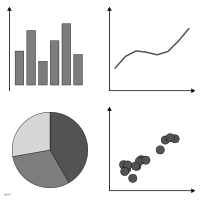 chartspecial case
Attestation
- French term: Bertin, Sémiologie graphique, 1967
- English definition: Semiology of graphics: diagrams, networks, maps
R code of the ggplot2 example
library(ggplot2)
library(dplyr)
library(palmerpenguins)
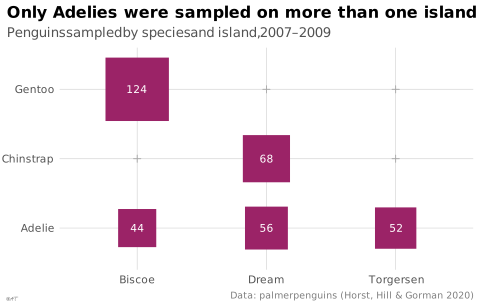
## Two components, species and islands, every species set against every
## island: the area of a square codes the number of penguins.
counts <- penguins |>
count(species, island) |>
tidyr::complete(species, island, fill = list(n = 0))
p <- ggplot(counts, aes(x = island, y = species)) +
geom_point(data = filter(counts, n > 0), aes(size = n), shape = 15, colour = "#9b2367") +
geom_point(data = filter(counts, n == 0), shape = 3, size = 1.5, colour = "#a6a6a6") +
geom_text(data = filter(counts, n > 0), aes(label = n), colour = "white", size = 2.8) +
scale_size_area(max_size = 22, guide = "none") +
labs(title = "Only Adelies were sampled on more than one island",
subtitle = "Penguins sampled by species and island, 2007–2009",
x = NULL, y = NULL,
caption = "Data: palmerpenguins (Horst, Hill & Gorman 2020)") +
theme_lex_viz(grid = "xy", arrows = "")Sources (112)
2591 occurrences in the corpus; indexed by 12 books
Show the 112 sources
- 100 diagrams that changed the world: from the earliest cave paintings to the innovation...
- A field guide to digital color
- alg.manifoldapp.org
- app.flourish.studio
- Applied Multivariate Statistics in R
- Atlas of knowledge: anyone can map
- Audric, de Bellefon & Durieux, « Analyse spatiale descriptive », Manuel d'analyse spatiale (Insee Méthodes n° 131), 2018
- Ault, Nam Liao & Musolino, Principles of Data Science, OpenStax, 2025
- Barnier, Introduction à R et au tidyverse
- Beautiful evidence
- Bertin, Sémiologie graphique, 1967
- Better data visualizations: a guide for scholars, researchers, and wonks
- Bremer & Barone, Chart, CRC Press, 2025
- Brilliant Maps for Curious Minds: 100 New Ways to See the World (Maps for Curious Minds)
- Building Science Graphics: An Illustrated Guide to Communicating Science through Diagra...
- Cartographies of Time
- Cartography: thematic map design
- Ciccione et al., The Superiority of Graphics over Text in Long-Term Memory Retention, Psychonomic Bulletin & Review, 2025↗
- Cook & Laa, Interactively Exploring High-Dimensional Data and Models in R, Chapman & Hall/CRC, 2026
- Data Feminism
- Data fluency: empowering your organization with effective data communication
- Data points: visualization that means something
- Data sketches
- Data Visualisation Guide, data.europa.eu
- Data visualisation: a handbook for data driven design
- Data visualization handbook
- Data visualization literacy: Definitions, conceptual frameworks, exercises, and assessm...
- Data Viz Project
- Data-driven storytelling
- data-to-viz.com
- dataphys.org
- datavizcatalogue.com
- datavizproject.com
- datawrapper.de↗
- Dehaene, “The Perception of Graphics: A New Instance of Neuronal Recycling”, lecture course at the Collège de France, 2025 (in French)↗
- Design for information: an introduction to the histories, theories, and best practices ...
- Effective data storytelling: how to drive change with data, narrative, and visuals
- Effective data visualization: the right chart for the right data
- Elavsky, Chartability: POUR-CAF accessibility heuristics
- Envisioning information
- Exploratory Data Analysis: Descriptive Analysis, Visualization, and Dashboard Design (w...
- French Wikipedia↗
- French Wikipedia — Visualisation de données
- Friendly & Wainer, A History of Data Visualization and Graphic Communication, Harvard University Press, 2021
- From data to viz
- Fundamentals of computer graphics
- Graphic presentation
- Graphics for learning: proven guidelines for planning, designing, and evaluating visual...
- Graphiques : vocabulaire, EBSI Montreal (after the GDT)↗
- Grosjean & Engels, Science des données biologiques I-III (University of Mons)
- Handling and mapping geographic information
- How charts lie: getting smarter about visual information
- How maps work: representation, visualization, and design
- Info we trust: how to inspire the world with data
- Information graphics
- Information Graphics: A Comprehensive Illustrated Reference
- Information theory tools for visualization
- Insee, Guide de sémiologie graphique, édition 2017↗
- Interactive data visualization: foundations, techniques, and applications
- La graphique et le traitement graphique de l'information
- Lagarenne, Minodier & Samson, « Comment présenter nos données pour mieux communiquer ? La datavisualisation : synthèse et simplicité », Courrier des statistiques n° 10 (Insee), 2023↗
- Larmarange et al., analyse-R: introduction to survey analysis with R
- Larmarange, guide-R: analysing survey data with R
- Les fondamentaux de la visualisation de données
- LibreTexts Statistics, textbook chapters on charts
- Living in data: a citizen's guide to a better information
- Magrit user manual, French version (UAR RIATE, CNRS)
- Making and Breaking the Grid, Third Edition
- Making numbers count: the art and science of communicating numbers
- Manuel de datavisualisation - 2e éd, vol. 2
- Milestones in the history of thematic cartography, statistical graphics, and data visua...
- Open Visualization Academy, courses and newsletter (Cairo et al.)
- Parallel sets: visual analysis of categorical data
- PBIL biostatistics notes (Chessel, Dufour, Thioulouse et al., Lyon 1)
- python-graph-gallery.com
- QCBS R Workshop Series, French version (Quebec Centre for Biodiversity Science)
- Questions in Dataviz: A Design-Driven Process for Data Visualisation
- Rakotomalala, statistics course notes (Université Lyon 2)
- Seeing with fresh eyes: meaning, space, data, truth
- Semiologie graphique: les diagrammes, les réseaux, les cartes.
- Semiology of graphics: diagrams, networks, maps
- Show me the numbers: designing tables and graphs to enlighten
- sronpersonalpages.nl
- The art of insight: how great visualization designers think
- The book of circles: visualizing spheres of knowledge
- The book of trees: visualizing branches of knowledge
- The eyes have it: A task by data type taxonomy for information visualizations
- The functional art: an introduction to information graphics and visualization
- The golden age of data visualization: how did we get here?
- The grammar of graphics
- The infographic history of the world
- The Minard System: The Complete Statistical Graphics of Charles-Joseph Minard
- The Oxford Handbook of Empirical Aesthetics
- The Truthful Art: Data, Charts, and Maps for Communication
- The Wall Street journal guide to information graphics: the dos and don'ts of presenting...
- Thematic Cartography and Geovisualization
- utilitR, collaborative R documentation (Insee)
- visionscarto.net↗
- Visual complexity: mapping patterns of information
- Visual explanations: images and quantities, evidence and narrative
- Visual strategies for biological data
- Visualization Analysis and Design
- Visualization of Time-Oriented Data
- Visualize This
- Visualizing Uncertainty About the Future
- Visualizing with text
- Web Content Accessibility Guidelines (WCAG) 2.1, authorized French translation (W3C)
- Wickham, Çetinkaya-Rundel & Grolemund, R for Data Science, 2nd ed., 2023
- Wikipedia — Data and information visualization
- Wikipedia in English↗
- Wilke, Fundamentals of Data Visualization, O'Reilly, 2019
- xeno.graphics↗
Cite this entry
Stable addresshttps://dataviz.adrientaudiere.com/en/term/diagram.html
ReferenceTaudière Adrien. 2026. diagram. In Visualization Vocabulary, version 1.0.0. IdEst. https://dataviz.adrientaudiere.com/en/term/diagram.html
BibTeX
@incollection{taudiere2026-diagram,
  author    = {Taudière, Adrien},
  title     = {diagram},
  booktitle = {Visualization Vocabulary},
  year      = {2026},
  version   = {1.0.0},
  publisher = {IdEst},
  url       = {https://dataviz.adrientaudiere.com/en/term/diagram.html},
  note      = {CC0 1.0}
}Page created on 2026-10-13. Text last changed on 2026-11-10. Images last changed on 2026-11-12. Numbers computed on 2026-10-22.