


 chart
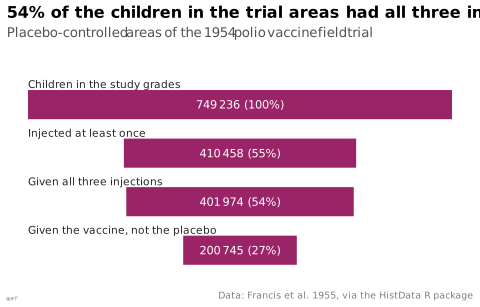
funnel chart
Successive steps of a process with a shrinking population.
Classification
- chart
- bars › sequential bars
- flow
- the name evokes: object
Channels
 length; main: count at each stage
 color luminance; secondary: stage
 color saturation; secondary: stage (instead of luminance)
 spatial region; main: stage, in order
Scientific literature
OpenAlex: 138 papers since 2013, 44% in the last five years; mostly in Medicine, Computer Science, Business, Management and Accounting; Wikidata
R packages
- R
ggplot2::geom_col(); GitHub 7 025 stars; last commit 2026-10; paper (33 455 citations)
R code of the ggplot2 example
library(ggplot2)
library(dplyr)
library(HistData)
## The placebo-controlled areas of the 1954 polio field trial, from all the
## children of the study grades to those injected with the vaccine.
trial <- filter(PolioTrials, Experiment == "RandomizedControl")
n <- \(groups) sum(trial$Population[trial$Group %in% groups])
stages <- tibble(
stage = c("Children in the study grades", "Injected at least once",
"Given all three injections", "Given the vaccine, not the placebo"),
n = c(n(trial$Group), n(c("Vaccinated", "Placebo", "IncompleteVaccinations")),
n(c("Vaccinated", "Placebo")), n("Vaccinated"))
) |>
mutate(y = rev(seq_along(stage)),
label = paste0(lex_number(n), " (", round(100 * n / n[1]), "%)"))
p <- ggplot(stages) +
geom_rect(aes(xmin = -n / 2, xmax = n / 2, ymin = y - 0.3, ymax = y + 0.3), fill = "#9b2367") +
geom_text(aes(x = 0, y = y, label = label), colour = "white", size = 3) +
geom_text(aes(x = -max(n) / 2, y = y + 0.34, label = stage), hjust = 0, vjust = 0,
size = 2.8, colour = "#262626") +
scale_y_continuous(limits = c(0.5, 4.95)) +
labs(title = "54% of the children in the trial areas had all three injections",
subtitle = "Placebo-controlled areas of the 1954 polio vaccine field trial",
x = NULL, y = NULL,
caption = "Data: Francis et al. 1955, via the HistData R package") +
theme_lex_viz(grid = "", arrows = "") +
theme(axis.text = element_blank())Sources (7)
4 occurrences in the corpus; indexed by 3 books
- Data visualization handbook
- Data Viz Project
- datavizproject.com
- Effective data storytelling: how to drive change with data, narrative, and visuals
- Practical charts: the essential guide to creating clear, compelling charts for reports ...
- Show me the numbers: designing tables and graphs to enlighten
- Wikipedia in English↗
Cite this entry
Stable addresshttps://dataviz.adrientaudiere.com/en-only/term/funnel-chart.html
ReferenceTaudière Adrien. 2026. funnel chart. In Visualization Vocabulary, version 1.0.0. IdEst. https://dataviz.adrientaudiere.com/en-only/term/funnel-chart.html
BibTeX
@incollection{taudiere2026-funnel-chart,
  author    = {Taudière, Adrien},
  title     = {funnel chart},
  booktitle = {Visualization Vocabulary},
  year      = {2026},
  version   = {1.0.0},
  publisher = {IdEst},
  url       = {https://dataviz.adrientaudiere.com/en-only/term/funnel-chart.html},
  note      = {CC0 1.0}
}Page created on 2026-10-13. Text last changed on 2026-11-02. Images last changed on 2026-11-02. Numbers computed on 2026-10-22.