
 chart
hive plot
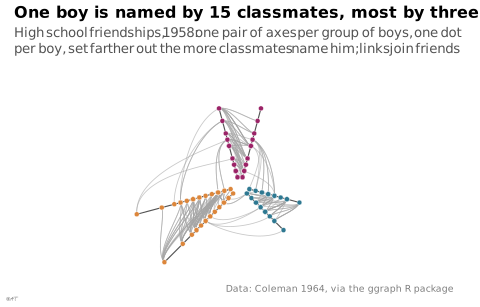
Network whose nodes sit on radial axes according to their attributes.
Classification
- chart
- networks and trees › linear networks
- flow
- the name evokes: nature
Channels
 position on unaligned scale; main: value of a node attribute along its axis
 spatial region; main: node class (its axis)
 color hue; secondary: link type
Attestation and synonyms
- English definition: Atlas of knowledge: anyone can map
Scientific literature
OpenAlex: 32 papers since 2013, 25% in the last five years; mostly in Computer Science, Biochemistry, Genetics and Molecular Biology, Medicine
Seminal references
R packages
- R
ggraph::geom_edge_hive(); GitHub 1 121 stars; last commit 2025-08 - R
HiveR::plotHive(); GitHub 75 stars; last commit 2024-07; paper (8 citations)
R code of the ggplot2 example
library(ggplot2)
library(dplyr)
library(igraph)
library(ggraph)
## Friendships named in 1958. One axis per group of boys found by the Louvain
## method, split in two so that ties inside a group show between the twin
## axes. The groups only spread the boys out: Louvain maximises the ties
## inside them. A boy's distance from the centre is the number of classmates
## who name him, on the same scale for every axis.
boys <- sort(unique(c(highschool$from, highschool$to)))
ties <- highschool |>
filter(year == 1958) |>
distinct(from, to)
named <- graph_from_data_frame(ties, vertices = data.frame(name = boys))
named <- delete_vertices(named, degree(named) == 0)
set.seed(1)
louvain <- membership(cluster_louvain(as_undirected(named, mode = "collapse"), resolution = 0.4))
V(named)$clique <- paste("Group", match(louvain, unique(louvain)))
V(named)$named_by <- degree(named, mode = "in")
p <- ggraph(named, layout = "hive", axis = clique, sort.by = named_by,
use.numeric = TRUE, normalize = FALSE, split.axes = "all") +
geom_edge_hive(colour = "#a6a6a6", edge_width = 0.3, edge_alpha = 0.6) +
geom_axis_hive(colour = "#535353", linewidth = 0.4, label = FALSE) +
geom_node_point(aes(fill = clique), shape = 21, colour = "white", stroke = 0.2, size = 1.6) +
scale_fill_manual(values = unname(lex_colors)) +
coord_equal(xlim = c(-2, 2), ylim = c(-0.85, 1.1), clip = "off") +
labs(title = "One boy is named by 15 classmates, most by three or fewer",
subtitle = "High school friendships, 1958: one pair of axes per group of boys, one dot per boy, set farther out the more classmates name him; links join friends",
caption = "Data: Coleman 1964, via the ggraph R package") +
theme_lex_viz(grid = "", arrows = "") +
theme(legend.position = "none", axis.text = element_blank(), axis.title = element_blank())Sources (5)
2 occurrences in the corpus
Cite this entry
Stable addresshttps://dataviz.adrientaudiere.com/en-only/term/hive-plot.html
ReferenceTaudière Adrien. 2026. hive plot. In Visualization Vocabulary, version 1.0.0. IdEst. https://dataviz.adrientaudiere.com/en-only/term/hive-plot.html
BibTeX
@incollection{taudiere2026-hive-plot,
  author    = {Taudière, Adrien},
  title     = {hive plot},
  booktitle = {Visualization Vocabulary},
  year      = {2026},
  version   = {1.0.0},
  publisher = {IdEst},
  url       = {https://dataviz.adrientaudiere.com/en-only/term/hive-plot.html},
  note      = {CC0 1.0}
}Page created on 2026-11-02. Text last changed on 2026-11-02. Images last changed on 2026-11-12. Numbers computed on 2026-10-22.