
 graphique
hive plot
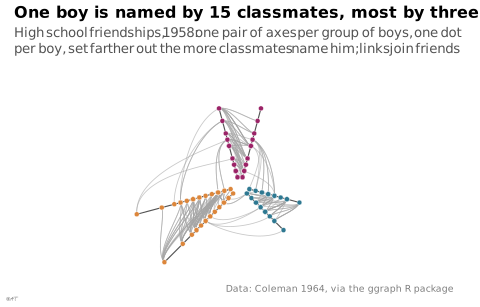
Réseau dont les nœuds se placent sur des axes rayonnants selon leurs attributs.
hive plot
Network whose nodes sit on radial axes according to their attributes.
Proposé par Krzywinski pour éviter la « pelote » des grands réseaux : la position d'un nœud dépend de ses attributs et non d'un algorithme de mise en page.
Classification
- graphique
- réseaux et arbres › réseaux linéaires
- flux
- le nom évoque : nature
Canaux
 position sur des échelles non alignées; principal : valeur d'un attribut du nœud le long de son axe
 région de l'espace; principal : classe du nœud (son axe)
 teinte; secondaire : type de lien
Attestation et synonymies
- terme français : Usage courant, non attesté par une source
- définition anglaise : Atlas of knowledge: anyone can map
Littérature scientifique
OpenAlex : 32 articles depuis 2013, dont 25 % ces cinq dernières années; surtout en Computer Science, Biochemistry, Genetics and Molecular Biology, Medicine
Références séminales
Paquets R
- R
ggraph::geom_edge_hive(); GitHub 1 121 étoiles; dernier commit 2025-08 avec la disposition « hive » de ggraph() - R
HiveR::plotHive(); GitHub 75 étoiles; dernier commit 2024-07; article (8 citations)
Code R de l'exemple ggplot2
library(ggplot2)
library(dplyr)
library(igraph)
library(ggraph)
## Friendships named in 1958. One axis per group of boys found by the Louvain
## method, split in two so that ties inside a group show between the twin
## axes. The groups only spread the boys out: Louvain maximises the ties
## inside them. A boy's distance from the centre is the number of classmates
## who name him, on the same scale for every axis.
boys <- sort(unique(c(highschool$from, highschool$to)))
ties <- highschool |>
filter(year == 1958) |>
distinct(from, to)
named <- graph_from_data_frame(ties, vertices = data.frame(name = boys))
named <- delete_vertices(named, degree(named) == 0)
set.seed(1)
louvain <- membership(cluster_louvain(as_undirected(named, mode = "collapse"), resolution = 0.4))
V(named)$clique <- paste("Group", match(louvain, unique(louvain)))
V(named)$named_by <- degree(named, mode = "in")
p <- ggraph(named, layout = "hive", axis = clique, sort.by = named_by,
use.numeric = TRUE, normalize = FALSE, split.axes = "all") +
geom_edge_hive(colour = "#a6a6a6", edge_width = 0.3, edge_alpha = 0.6) +
geom_axis_hive(colour = "#535353", linewidth = 0.4, label = FALSE) +
geom_node_point(aes(fill = clique), shape = 21, colour = "white", stroke = 0.2, size = 1.6) +
scale_fill_manual(values = unname(lex_colors)) +
coord_equal(xlim = c(-2, 2), ylim = c(-0.85, 1.1), clip = "off") +
labs(title = "One boy is named by 15 classmates, most by three or fewer",
subtitle = "High school friendships, 1958: one pair of axes per group of boys, one dot per boy, set farther out the more classmates name him; links join friends",
caption = "Data: Coleman 1964, via the ggraph R package") +
theme_lex_viz(grid = "", arrows = "") +
theme(legend.position = "none", axis.text = element_blank(), axis.title = element_blank())Sources (5)
2 occurrences dans le corpus
Citer cette fiche
Adresse stablehttps://dataviz.adrientaudiere.com/terme/hive-plot.html
RéférenceTaudière Adrien. 2026. hive plot. Dans Visualization Vocabulary, version 1.0.0. IdEst. https://dataviz.adrientaudiere.com/terme/hive-plot.html
BibTeX
@incollection{taudiere2026-hive-plot,
  author    = {Taudière, Adrien},
  title     = {hive plot},
  booktitle = {Visualization Vocabulary},
  year      = {2026},
  version   = {1.0.0},
  publisher = {IdEst},
  url       = {https://dataviz.adrientaudiere.com/terme/hive-plot.html},
  note      = {CC0 1.0}
}Fiche créée le 02/11/2026. Texte modifié le 02/11/2026. Images modifiées le 12/11/2026. Chiffres calculés le 22/10/2026.