
 chart
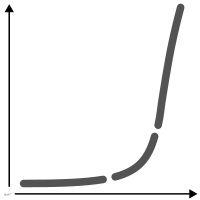
hockey stick chart
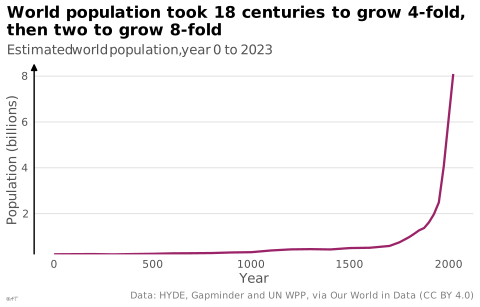
Long flat curve that bends sharply upward at the end of the series.
Classification
- chart
- lines and areas › lines
- change over time
- the name evokes: object
Channels
 position on common scale; main: value
 tilt/angle; secondary: acceleration (final break in slope)
Attestation
- English definition: Tufte, The Visual Display of Quantitative Information, 2nd ed., 2001
Scientific literature
OpenAlex: 2 papers since 2011, 0% in the last five years; mostly in Economics, Econometrics and Finance, Social Sciences
Seminal references
R code of the ggplot2 example
library(ggplot2)
library(tibble)
## World population (millions), every century to 1700, then every 25 years,
## as published by Our World in Data (HYDE 2023, Gapminder 2022, UN WPP 2024).
world <- tribble(
~year, ~pop,
0, 232, 100, 237, 200, 241, 300, 228, 400, 242, 500, 253, 600, 272, 700, 278,
800, 286, 900, 311, 1000, 323, 1100, 398, 1200, 445, 1300, 456, 1400, 442,
1500, 503, 1600, 516, 1700, 595, 1750, 753, 1800, 983, 1825, 1125, 1850, 1276,
1875, 1375, 1900, 1627, 1925, 1979, 1950, 2493, 1975, 4071, 2000, 6172, 2023, 8092
)
p <- ggplot(world, aes(x = year, y = pop / 1000)) +
geom_line(colour = "#9b2367", linewidth = 0.8) +
scale_x_continuous(breaks = seq(0, 2000, 500)) +
scale_y_continuous(labels = lex_number, expand = expansion(mult = c(0, 0.05))) +
labs(title = "World population took 18 centuries to grow 4-fold,\nthen two to grow 8-fold",
subtitle = "Estimated world population, year 0 to 2023",
x = "Year", y = "Population (billions)",
caption = "Data: HYDE, Gapminder and UN WPP, via Our World in Data (CC BY 4.0)") +
theme_lex_viz(grid = "y", arrows = "y")Sources (6)
14 occurrences in the corpus; indexed by 2 books
- Data Visualisation Guide, data.europa.eu
- How charts lie: getting smarter about visual information
- Open Visualization Academy, courses and newsletter (Cairo et al.)
- The art of insight: how great visualization designers think
- The Truthful Art: Data, Charts, and Maps for Communication
- Tufte, The Visual Display of Quantitative Information, 2nd ed., 2001
Cite this entry
Stable addresshttps://dataviz.adrientaudiere.com/en-only/term/hockey-stick-chart.html
ReferenceTaudière Adrien. 2026. hockey stick chart. In Visualization Vocabulary, version 1.0.0. IdEst. https://dataviz.adrientaudiere.com/en-only/term/hockey-stick-chart.html
BibTeX
@incollection{taudiere2026-hockey-stick-chart,
  author    = {Taudière, Adrien},
  title     = {hockey stick chart},
  booktitle = {Visualization Vocabulary},
  year      = {2026},
  version   = {1.0.0},
  publisher = {IdEst},
  url       = {https://dataviz.adrientaudiere.com/en-only/term/hockey-stick-chart.html},
  note      = {CC0 1.0}
}Page created on 2026-10-13. Text last changed on 2026-11-02. Images last changed on 2026-11-12. Numbers computed on 2026-10-22.