
 chart
hockey stick chart
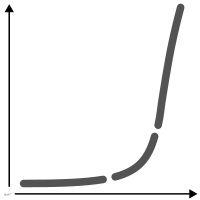
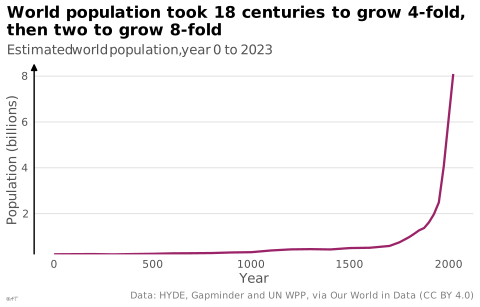
Long flat curve that bends sharply upward at the end of the series.
courbe en crosse de hockey
Courbe longtemps plate qui s'infléchit brusquement vers le haut en fin de série.
Classification
- chart
- lines and areas › lines
- change over time
- the name evokes: object
Channels
 position on common scale; main: value
 tilt/angle; secondary: acceleration (final break in slope)
Attestation
Scientific literature
OpenAlex: 2 papers since 2011, 0% in the last five years; mostly in Economics, Econometrics and Finance, Social Sciences
Seminal references
R code of the ggplot2 example
library(ggplot2)
library(tibble)
## World population (millions), every century to 1700, then every 25 years,
## as published by Our World in Data (HYDE 2023, Gapminder 2022, UN WPP 2024).
world <- tribble(
~year, ~pop,
0, 232, 100, 237, 200, 241, 300, 228, 400, 242, 500, 253, 600, 272, 700, 278,
800, 286, 900, 311, 1000, 323, 1100, 398, 1200, 445, 1300, 456, 1400, 442,
1500, 503, 1600, 516, 1700, 595, 1750, 753, 1800, 983, 1825, 1125, 1850, 1276,
1875, 1375, 1900, 1627, 1925, 1979, 1950, 2493, 1975, 4071, 2000, 6172, 2023, 8092
)
p <- ggplot(world, aes(x = year, y = pop / 1000)) +
geom_line(colour = "#9b2367", linewidth = 0.8) +
scale_x_continuous(breaks = seq(0, 2000, 500)) +
scale_y_continuous(labels = lex_number, expand = expansion(mult = c(0, 0.05))) +
labs(title = "World population took 18 centuries to grow 4-fold,\nthen two to grow 8-fold",
subtitle = "Estimated world population, year 0 to 2023",
x = "Year", y = "Population (billions)",
caption = "Data: HYDE, Gapminder and UN WPP, via Our World in Data (CC BY 4.0)") +
theme_lex_viz(grid = "y", arrows = "y")Sources (7)
14 occurrences in the corpus; indexed by 2 books
- Data Visualisation Guide, data.europa.eu
- How charts lie: getting smarter about visual information
- Open Visualization Academy, courses and newsletter (Cairo et al.)
- Scotto d'Apollonia, Les controverses climatiques : une analyse socioépistémique, PhD thesis, Université Montpellier III, 2014↗
- The art of insight: how great visualization designers think
- The Truthful Art: Data, Charts, and Maps for Communication
- Tufte, The Visual Display of Quantitative Information, 2nd ed., 2001
Cite this entry
Stable addresshttps://dataviz.adrientaudiere.com/en/term/hockey-stick-chart.html
ReferenceTaudière Adrien. 2026. hockey stick chart. In Visualization Vocabulary, version 1.0.0. IdEst. https://dataviz.adrientaudiere.com/en/term/hockey-stick-chart.html
BibTeX
@incollection{taudiere2026-hockey-stick-chart,
  author    = {Taudière, Adrien},
  title     = {hockey stick chart},
  booktitle = {Visualization Vocabulary},
  year      = {2026},
  version   = {1.0.0},
  publisher = {IdEst},
  url       = {https://dataviz.adrientaudiere.com/en/term/hockey-stick-chart.html},
  note      = {CC0 1.0}
}Page created on 2026-10-13. Text last changed on 2026-11-02. Images last changed on 2026-11-12. Numbers computed on 2026-10-22.