
 chart
kagi chart
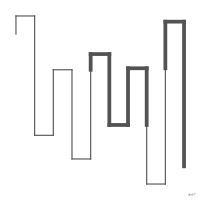
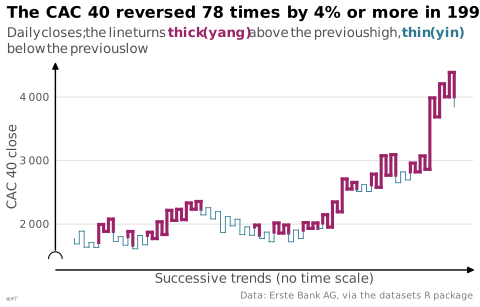
Price chart without a time scale, drawn as a vertical line that turns back only when the price retraces by more than a preset amount.
Classification
- chart
- lines and areas › lines
- change over time
Channels
 position on common scale; main: price at trend reversals (horizontal axis without time)
 color hue; secondary: yang or yin (when color replaces or doubles line thickness)
Attestation and synonyms
- English definition: Wikipedia in English↗
- graphique en Kagi; datavizcatalogue.com
Scientific literature
OpenAlex: 12 papers since 2012, 25% in the last five years; mostly in Economics, Econometrics and Finance, Decision Sciences; Wikidata
R code of the ggplot2 example
library(ggplot2)
## Daily closes of the CAC 40, 1991-1998 (EuStockMarkets). A Kagi chart
## ignores time: a vertical line follows the price until it reverses by 4%
## or more from its extreme, then a new line starts one step to the right.
price <- as.numeric(EuStockMarkets[, "CAC"])
reversal <- 0.04
## 1. One vertical line per trend, from its start to its extreme.
trends <- data.frame(from = numeric(0), to = numeric(0))
start <- price[1]
extreme <- price[1]
direction <- 0
for (v in price[-1]) {
if (direction == 0) {
if (abs(v / start - 1) >= reversal) {
direction <- sign(v - start)
extreme <- v
}
} else if ((v - extreme) * direction > 0) {
extreme <- v
} else if (abs(v / extreme - 1) >= reversal) {
trends[nrow(trends) + 1, ] <- c(start, extreme)
start <- extreme
extreme <- v
direction <- -direction
}
}
trends[nrow(trends) + 1, ] <- c(start, extreme)
## 2. The line turns thick (yang) when it rises above the previous high
## (shoulder), thin (yin) when it falls below the previous low (waist); a
## vertical line is split where it crosses that level. The horizontal step
## to the next line keeps the current thickness.
segments <- list()
add <- function(x, y, xend, yend, yang) {
segments[[length(segments) + 1]] <<- data.frame(x, y, xend, yend, yang)
}
yang <- trends$to[1] > trends$from[1]
shoulder <- NA
waist <- NA
for (i in seq_len(nrow(trends))) {
a <- trends$from[i]
b <- trends$to[i]
if (b > a && !yang && !is.na(shoulder) && b > shoulder) {
add(i, a, i, shoulder, FALSE)
add(i, shoulder, i, b, TRUE)
yang <- TRUE
} else if (b < a && yang && !is.na(waist) && b < waist) {
add(i, a, i, waist, TRUE)
add(i, waist, i, b, FALSE)
yang <- FALSE
} else {
add(i, a, i, b, yang)
}
if (b > a) {
shoulder <- b
} else {
waist <- b
}
if (i < nrow(trends)) {
add(i, b, i + 1, b, yang)
}
}
segments <- do.call(rbind, segments)
p <- ggplot(segments, aes(x, y, xend = xend, yend = yend,
linewidth = yang, colour = yang)) +
geom_segment(lineend = "square") +
scale_linewidth_manual(values = c("TRUE" = 1.1, "FALSE" = 0.3)) +
scale_colour_manual(values = c("TRUE" = unname(lex_colors["plum"]),
"FALSE" = unname(lex_colors["blue"]))) +
scale_y_continuous(labels = lex_number, breaks = lex_break_breaks,
expand = lex_break_expand) +
labs(title = "The CAC 40 reversed 78 times by 4% or more in 1991–1998",
subtitle = paste("Daily closes; the line turns",
"<span style='color:#9b2367'>**thick (yang)**</span> above the previous high,",
"<span style='color:#2e7891'>**thin (yin)**</span> below the previous low"),
x = "Successive trends (no time scale)", y = "CAC 40 close",
caption = "Data: Erste Bank AG, via the datasets R package") +
theme_lex_viz(grid = "y", break_not_zero = "y") +
theme(axis.text.x = element_blank(), legend.position = "none")Sources (3)
Cite this entry
Stable addresshttps://dataviz.adrientaudiere.com/en-only/term/kagi-chart.html
ReferenceTaudière Adrien. 2026. kagi chart. In Visualization Vocabulary, version 1.0.0. IdEst. https://dataviz.adrientaudiere.com/en-only/term/kagi-chart.html
BibTeX
@incollection{taudiere2026-kagi-chart,
  author    = {Taudière, Adrien},
  title     = {kagi chart},
  booktitle = {Visualization Vocabulary},
  year      = {2026},
  version   = {1.0.0},
  publisher = {IdEst},
  url       = {https://dataviz.adrientaudiere.com/en-only/term/kagi-chart.html},
  note      = {CC0 1.0}
}Page created on 2026-11-09. Text last changed on 2026-11-10. Images last changed on 2026-11-10. Numbers computed on 2026-10-22.