
 graphique
 Kagi
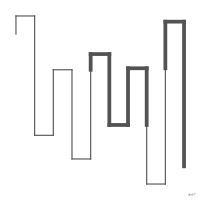
Graphique boursier sans échelle de temps, dont la ligne verticale ne repart en sens inverse qu'après un retournement du cours supérieur à un seuil fixé.
kagi chart
Price chart without a time scale, drawn as a vertical line that turns back only when the price retraces by more than a preset amount.
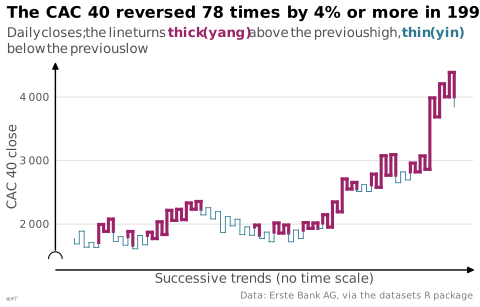
Né au Japon dans les années 1870 pour suivre le cours du riz (Wikipédia). Le trait s'épaissit (yang) quand le cours dépasse le sommet précédent et s'amincit (yin) sous le creux précédent ; la couleur remplace souvent l'épaisseur.
Classification
- graphique
- courbes et aires › courbes
- évolution dans le temps
Canaux
 position sur une échelle commune; principal : cours aux retournements de tendance (axe horizontal sans temps)
 teinte; secondaire : yang ou yin (quand la couleur remplace ou double l'épaisseur du trait)
Attestation et synonymies
- terme français : Wikipédia en français↗
- définition anglaise : Wikipedia in English↗
- graphique en Kagi; datavizcatalogue.com
Littérature scientifique
OpenAlex : 12 articles depuis 2012, dont 25 % ces cinq dernières années; surtout en Economics, Econometrics and Finance, Decision Sciences; Wikidata
Code R de l'exemple ggplot2
library(ggplot2)
## Daily closes of the CAC 40, 1991-1998 (EuStockMarkets). A Kagi chart
## ignores time: a vertical line follows the price until it reverses by 4%
## or more from its extreme, then a new line starts one step to the right.
price <- as.numeric(EuStockMarkets[, "CAC"])
reversal <- 0.04
## 1. One vertical line per trend, from its start to its extreme.
trends <- data.frame(from = numeric(0), to = numeric(0))
start <- price[1]
extreme <- price[1]
direction <- 0
for (v in price[-1]) {
if (direction == 0) {
if (abs(v / start - 1) >= reversal) {
direction <- sign(v - start)
extreme <- v
}
} else if ((v - extreme) * direction > 0) {
extreme <- v
} else if (abs(v / extreme - 1) >= reversal) {
trends[nrow(trends) + 1, ] <- c(start, extreme)
start <- extreme
extreme <- v
direction <- -direction
}
}
trends[nrow(trends) + 1, ] <- c(start, extreme)
## 2. The line turns thick (yang) when it rises above the previous high
## (shoulder), thin (yin) when it falls below the previous low (waist); a
## vertical line is split where it crosses that level. The horizontal step
## to the next line keeps the current thickness.
segments <- list()
add <- function(x, y, xend, yend, yang) {
segments[[length(segments) + 1]] <<- data.frame(x, y, xend, yend, yang)
}
yang <- trends$to[1] > trends$from[1]
shoulder <- NA
waist <- NA
for (i in seq_len(nrow(trends))) {
a <- trends$from[i]
b <- trends$to[i]
if (b > a && !yang && !is.na(shoulder) && b > shoulder) {
add(i, a, i, shoulder, FALSE)
add(i, shoulder, i, b, TRUE)
yang <- TRUE
} else if (b < a && yang && !is.na(waist) && b < waist) {
add(i, a, i, waist, TRUE)
add(i, waist, i, b, FALSE)
yang <- FALSE
} else {
add(i, a, i, b, yang)
}
if (b > a) {
shoulder <- b
} else {
waist <- b
}
if (i < nrow(trends)) {
add(i, b, i + 1, b, yang)
}
}
segments <- do.call(rbind, segments)
p <- ggplot(segments, aes(x, y, xend = xend, yend = yend,
linewidth = yang, colour = yang)) +
geom_segment(lineend = "square") +
scale_linewidth_manual(values = c("TRUE" = 1.1, "FALSE" = 0.3)) +
scale_colour_manual(values = c("TRUE" = unname(lex_colors["plum"]),
"FALSE" = unname(lex_colors["blue"]))) +
scale_y_continuous(labels = lex_number, breaks = lex_break_breaks,
expand = lex_break_expand) +
labs(title = "The CAC 40 reversed 78 times by 4% or more in 1991–1998",
subtitle = paste("Daily closes; the line turns",
"<span style='color:#9b2367'>**thick (yang)**</span> above the previous high,",
"<span style='color:#2e7891'>**thin (yin)**</span> below the previous low"),
x = "Successive trends (no time scale)", y = "CAC 40 close",
caption = "Data: Erste Bank AG, via the datasets R package") +
theme_lex_viz(grid = "y", break_not_zero = "y") +
theme(axis.text.x = element_blank(), legend.position = "none")Sources (4)
Citer cette fiche
Adresse stablehttps://dataviz.adrientaudiere.com/terme/kagi-chart.html
RéférenceTaudière Adrien. 2026. graphique Kagi. Dans Visualization Vocabulary, version 1.0.0. IdEst. https://dataviz.adrientaudiere.com/terme/kagi-chart.html
BibTeX
@incollection{taudiere2026-kagi-chart,
  author    = {Taudière, Adrien},
  title     = {graphique Kagi},
  booktitle = {Visualization Vocabulary},
  year      = {2026},
  version   = {1.0.0},
  publisher = {IdEst},
  url       = {https://dataviz.adrientaudiere.com/terme/kagi-chart.html},
  note      = {CC0 1.0}
}Fiche créée le 09/11/2026. Texte modifié le 10/11/2026. Images modifiées le 10/11/2026. Chiffres calculés le 22/10/2026.